
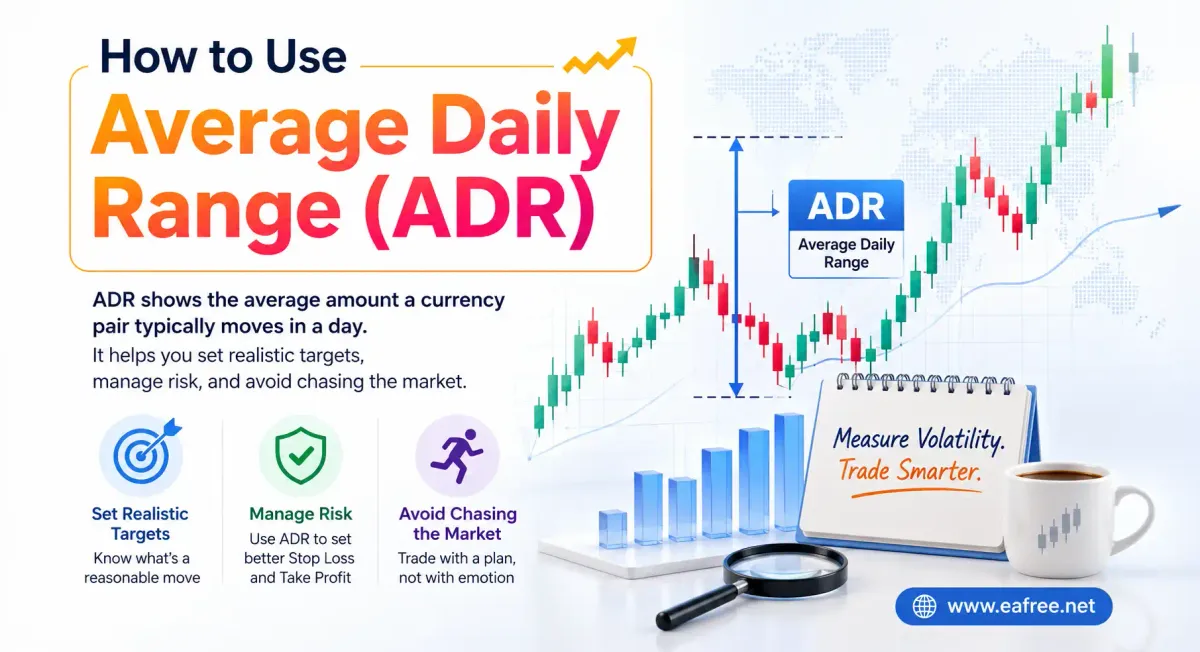
What is Average Daily Range (ADR)?
The Average Daily Range (ADR) is a technical indicator that measures the average number of pips a currency pair moves over a specific period (usually 5, 10, or 20 days). Unlike the Average True Range (ATR), which includes gaps between trading sessions, ADR strictly measures the distance between the Daily High and the Daily Low.
Understanding ADR is crucial because it tells you the statistical "limit" of a currency pair's movement for the day. If a pair usually moves 100 pips a day and has already moved 95 pips, the probability of it moving another 50 pips in the same direction is mathematically low.
ADR vs ATR: Understanding the Difference
While both indicators measure volatility, they serve different purposes. ATR is often used for setting stop losses because it accounts for price gaps, whereas ADR is the "gold standard" for intraday price boundaries and profit-taking.
| Feature | Average Daily Range (ADR) | Average True Range (ATR) |
| Calculation | (High - Low) / Period | Includes gaps between sessions |
| Primary Use | Daily profit targets & exhaustion levels | Stop loss placement & volatility |
| Best For | Intraday Traders | Swing Traders & Trend Followers |
| Visual | Fixed pip value | Fluctuating line |
Why ADR Matters for Your Trading Strategy
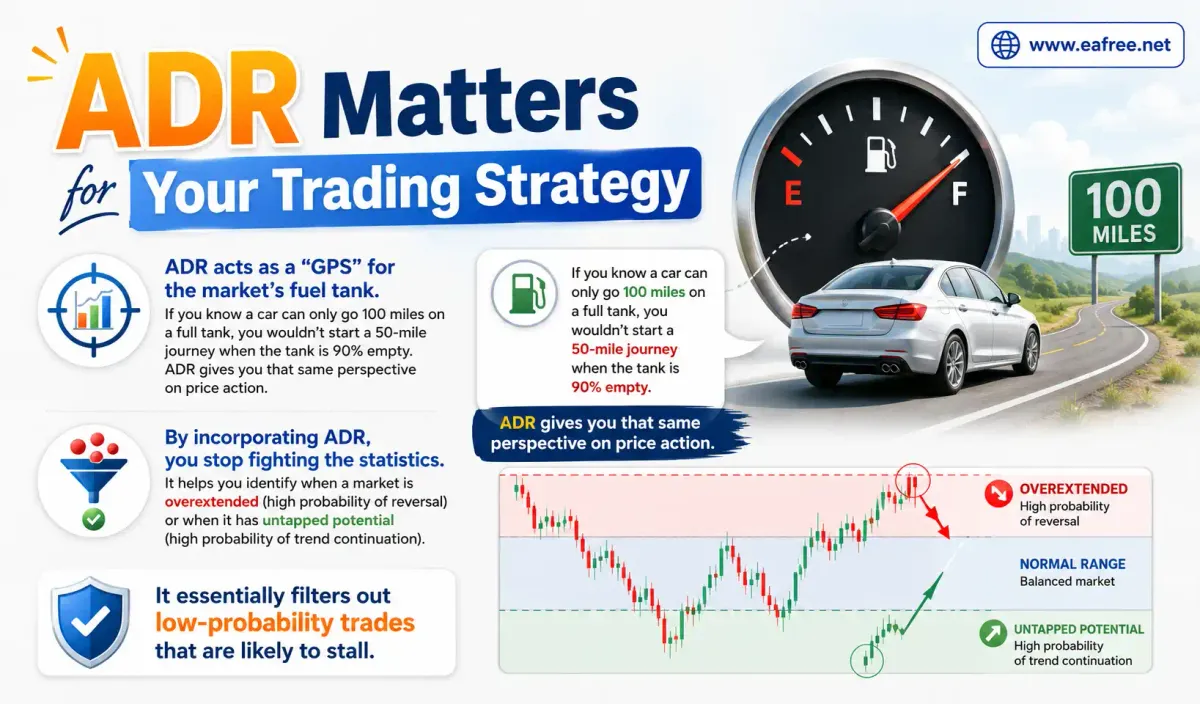
ADR acts as a "GPS" for the market's fuel tank. If you know a car can only go 100 miles on a full tank, you wouldn't start a 50-mile journey when the tank is 90% empty. ADR gives you that same perspective on price action.
By incorporating ADR, you stop fighting the statistics. It helps you identify when a market is overextended (high probability of reversal) or when it has untapped potential (high probability of trend continuation). It essentially filters out low-probability trades that are likely to stall.
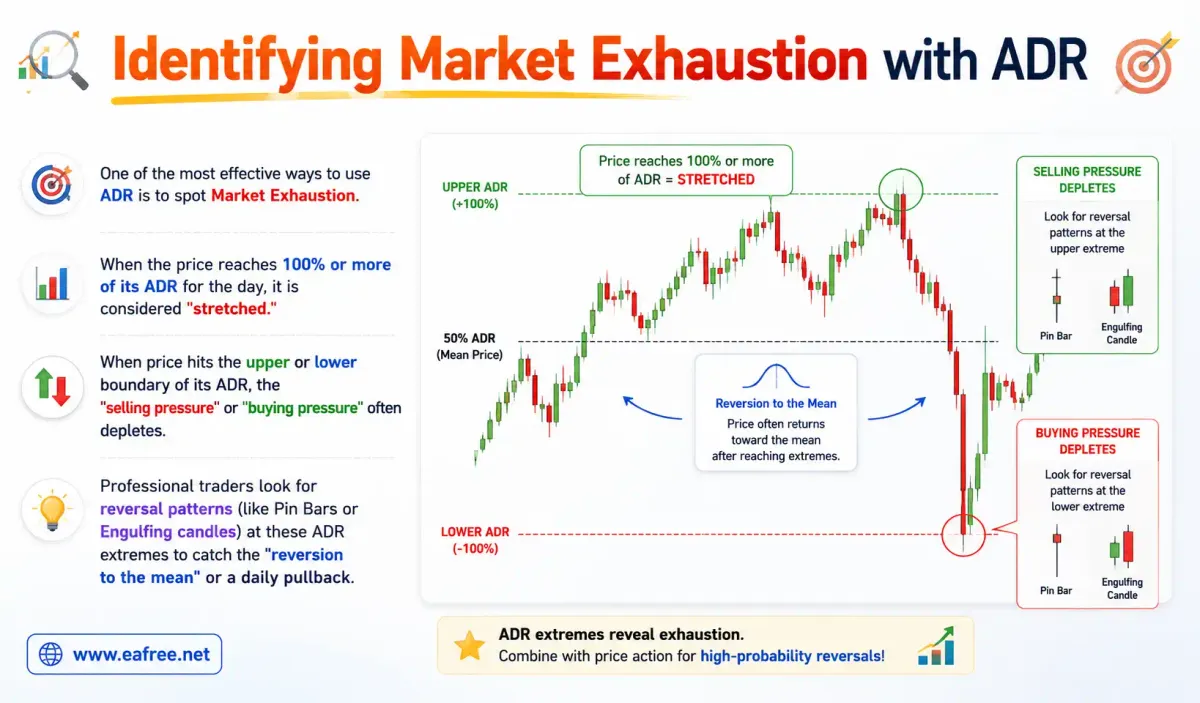
Identifying Market Exhaustion with ADR
One of the most effective ways to use ADR is to spot Market Exhaustion. When the price reaches 100% or more of its ADR for the day, it is considered "stretched."
When price hits the upper or lower boundary of its ADR, the "selling pressure" or "buying pressure" often depletes. Professional traders look for reversal patterns (like Pin Bars or Engulfing candles) at these ADR extremes to catch the "reversion to the mean" or a daily pullback.
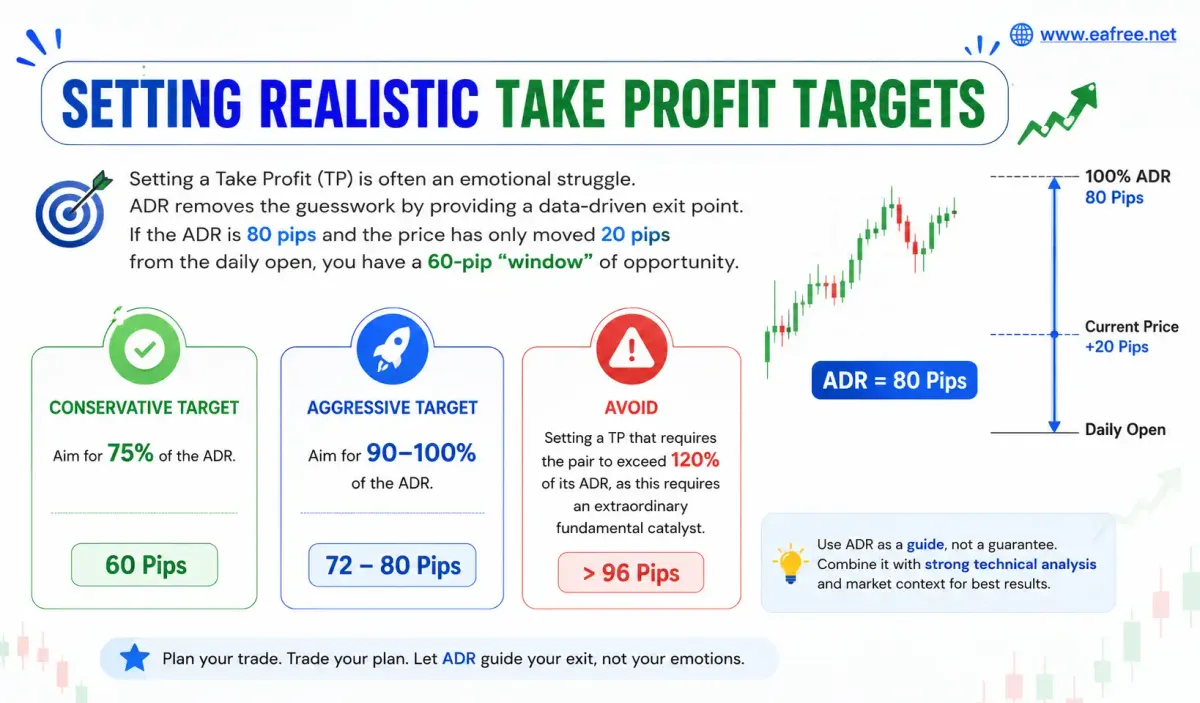
Setting Realistic Take Profit Targets
Setting a Take Profit (TP) is often an emotional struggle. ADR removes the guesswork by providing a data-driven exit point. If the ADR is 80 pips and the price has only moved 20 pips from the daily open, you have a 60-pip "window" of opportunity.
- Conservative Target: Aim for 75% of the ADR.
- Aggressive Target: Aim for 90-100% of the ADR.
- Avoid: Setting a TP that requires the pair to exceed 120% of its ADR, as this requires an extraordinary fundamental catalyst.
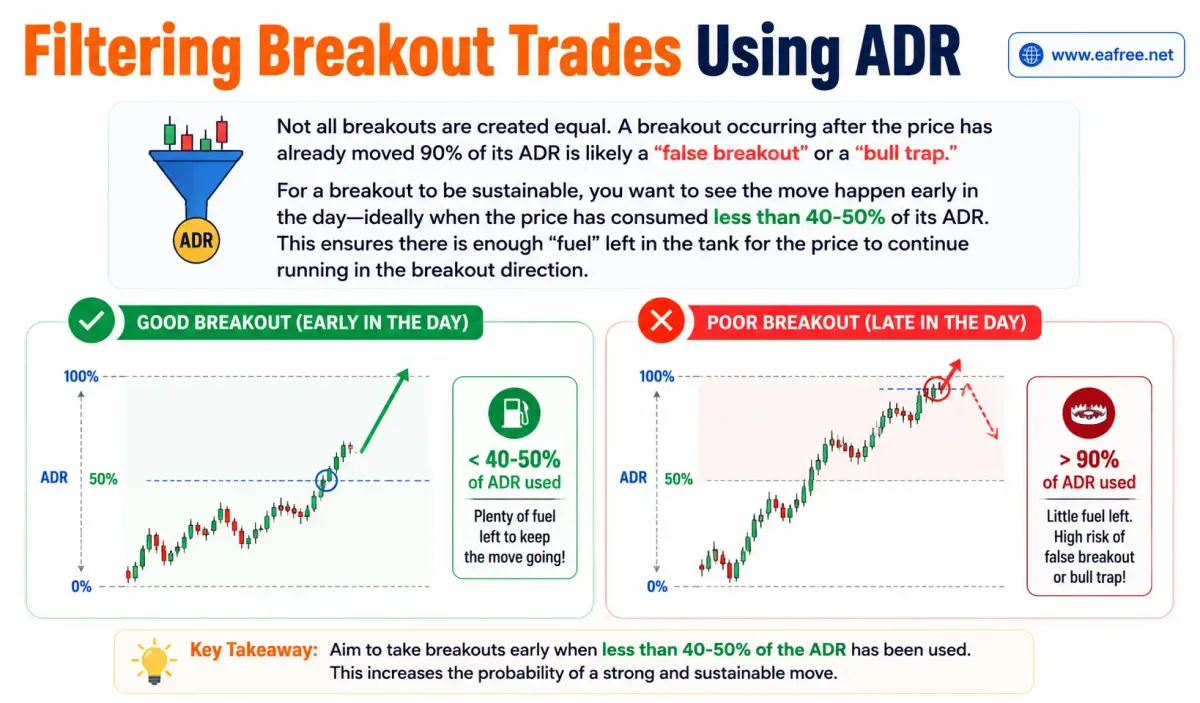
Filtering Breakout Trades Using ADR
Not all breakouts are created equal. A breakout occurring after the price has already moved 90% of its ADR is likely a "false breakout" or a "bull trap."
For a breakout to be sustainable, you want to see the move happen early in the day—ideally when the price has consumed less than 40-50% of its ADR. This ensures there is enough "fuel" left in the tank for the price to continue running in the breakout direction.
Top Tips for Using ADR Effectively
To maximize the utility of the Average Daily Range, you must treat it as a secondary filter, not a standalone signal.
- Combine with Support/Resistance: An ADR high that aligns with a historical resistance level is a high-probability reversal zone.
- Watch the News: On days with major NFP or Interest Rate decisions, ADR can be doubled or tripled.
- Check the Sessions: The ADR is often filled during the London and New York sessions. If the range is already hit during London, the New York session may be choppy or sideways.
Common Mistakes to Avoid
The biggest mistake traders make is ignoring the context of the ADR. Just because a pair has hit its ADR doesn't mean it must stop immediately; it just means the probability of further movement has decreased.
Another error is using a period that is too long or too short. A 20-day ADR is great for identifying long-term volatility shifts, while a 5-day ADR is better for catching immediate market heat. Using only one might give you a skewed perspective of current conditions.
Summary: The Power of Probability
Incorporating ADR into your Forex toolkit is about shifting from "guessing" to "calculating." It provides a clear boundary for daily price action, allowing you to enter trades with more confidence and exit with more precision. Whether you are a scalper or a day trader, knowing the daily range is the difference between trading with the wind at your back or shouting into a hurricane.
FAQs
❓ Can ADR be used on any timeframe?
While the calculation is based on daily candles, the ADR levels are most effective when projected onto lower timeframes like the 15-minute or 1-hour charts to help intraday traders find entry and exit points.
❓ What happens to ADR during high-impact news?
During major news events, ADR can be easily exceeded. In these cases, the ADR acts less as a hard ceiling and more as a reminder that the market is in an "extreme" state.
❓ Is a high ADR better for trading?
Not necessarily. High ADR means high volatility (e.g., GBP/JPY), which offers more profit potential but also higher risk. Low ADR pairs (e.g., EUR/CHF) are more stable but require larger positions to make significant gains.
❓ Should I use ADR for swing trading?
ADR is primarily a tool for day traders. Swing traders who hold positions for weeks are better off using the Average Weekly Range (AWR) or the standard ATR for their analysis.
❓ Which currency pairs have the highest ADR?
Typically, "Crosses" like GBP/JPY, EUR/NZD, and GBP/AUD have the highest ADR, often exceeding 150-200 pips. Major pairs like EUR/USD usually hover between 70-100 pips.