Introduction
In the world of technical analysis, few indicators are as widely used and respected as Bollinger Bands. Whether you are a beginner or an experienced trader, understanding how to use this tool can significantly improve your trading decisions. Bollinger Bands help traders identify volatility, potential entry and exit points and overall market trends.
This complete guide will walk you through everything you need to know about Bollinger Bands—from the basics to advanced strategies—so you can confidently apply them in your trading.
What are Bollinger Bands?
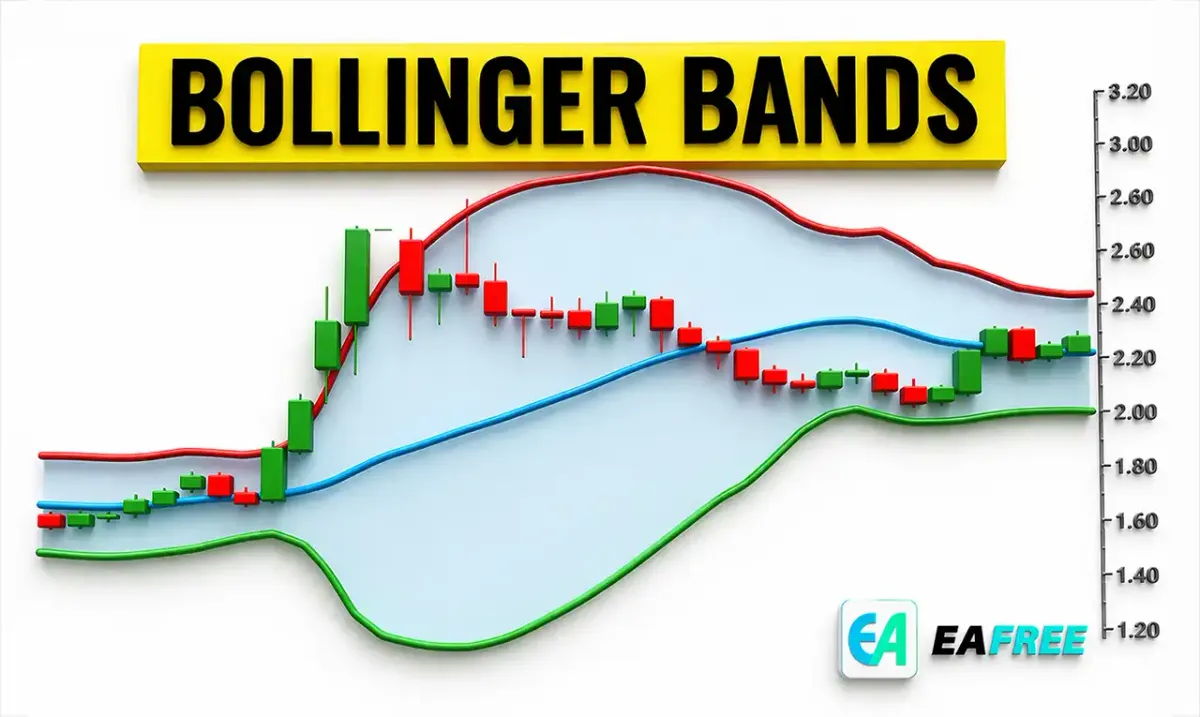
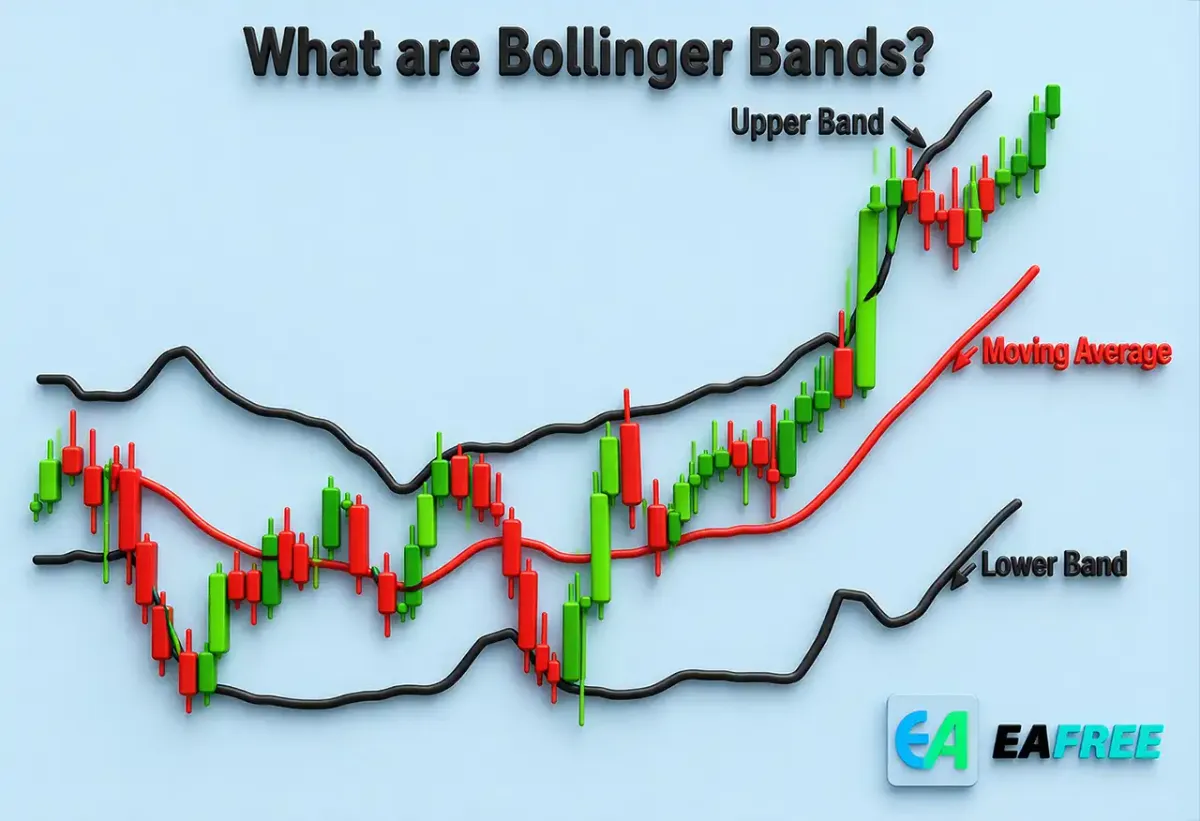
Bollinger Bands are a technical analysis indicator developed by John Bollinger in the 1980s. They consist of three lines plotted on a price chart:
- Middle Band: A simple moving average (usually 20 periods)
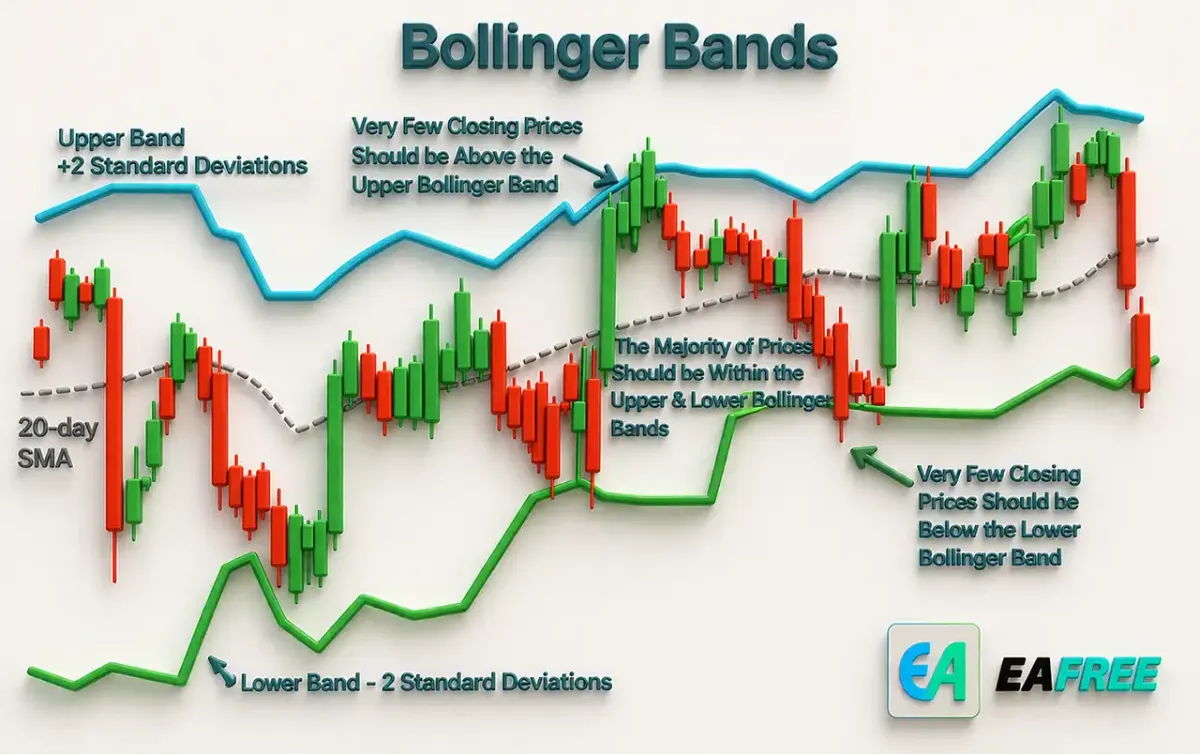
- Upper Band: Middle band + (2 standard deviations)
- Lower Band: Middle band − (2 standard deviations)
These bands expand and contract based on market volatility. When the market becomes more volatile, the bands widen. When volatility decreases, the bands tighten.
How Bollinger Bands Work
The key idea behind Bollinger Bands is that price tends to stay within a certain range most of the time. The bands act as dynamic support and resistance levels.
- When price approaches the upper band, it may be overbought
- When price touches the lower band, it may be oversold
- When bands contract, it signals low volatility (possible breakout soon)
- When bands expand, it indicates high volatility
This makes Bollinger Bands useful for both trend-following and mean-reversion strategies.
Key Components Explained
//1. Middle Band (Moving Average)
The middle band is typically a 20-period Simple Moving Average (SMA). It represents the average price over a given time period and acts as a baseline.
//2. Standard Deviation
Standard deviation measures how far prices deviate from the average. Higher deviation means more volatility, causing the bands to widen.
//3. Upper and Lower Bands
These bands adjust dynamically with volatility and help traders identify extreme price levels.
Why Use Bollinger Bands?
Bollinger Bands are popular because they provide multiple insights in one indicator:
- Measure market volatility
- Identify overbought and oversold conditions
- Detect potential breakouts
- Confirm trends
Unlike many indicators, Bollinger Bands adapt to market conditions, making them highly versatile.
Common Bollinger Bands Strategies
//1. Bollinger Bounce Strategy
This strategy is based on the idea that price tends to revert to the mean.
How it works:
- Buy when price touches the lower band
- Sell when price touches the upper band
Best used in: Ranging markets
Warning: This strategy can fail in strong trends where price “rides the band.”
//2. Bollinger Squeeze Strategy
The “squeeze” occurs when the bands become very narrow, indicating low volatility.
What it signals:
- A potential breakout is coming
How to trade it:
- Wait for a breakout above or below the bands
- Confirm with volume or other indicators
Best used in: Pre-breakout conditions
//3. Trend Following Strategy
In strong trends, price often hugs one band.
Bullish trend:
- Price stays near the upper band
- Pullbacks to the middle band can be buying opportunities
Bearish trend:
- Price stays near the lower band
- Rallies to the middle band can be selling opportunities
//4. Double Bottom (W-Bottom) Pattern
This is a reversal pattern using Bollinger Bands:
- First low touches the lower band
- Second low stays above the lower band
- Indicates weakening downward momentum
Signal: Potential bullish reversal
//5. Double Top (M-Top) Pattern
Opposite of W-bottom:
- First high touches upper band
- Second high fails to reach upper band
Signal: Potential bearish reversal
Best Settings for Beginners
The default settings for Bollinger Bands are:
- Period: 20
- Standard deviation: 2
These settings work well for most markets and timeframes. Beginners should start with these before experimenting.
Combining Bollinger Bands with Other Indicators
Using Bollinger Bands alone is helpful, but combining them with other indicators increases accuracy.
//1. RSI (Relative Strength Index)
- Confirms overbought/oversold conditions
- Example: Price hits upper band + RSI above 70 = stronger sell signal
//2. MACD (Moving Average Convergence Divergence)
- Helps confirm trend direction
- Useful for breakout validation
//3. Volume Indicators
- High volume confirms breakouts
- Low volume may indicate false signals
Advantages of Bollinger Bands
- Easy to understand and apply
- Adapt to market volatility
- Work across multiple markets (stocks, forex, crypto)
- Suitable for different trading styles
Limitations of Bollinger Bands
- Not a standalone system
- Can give false signals in strong trends
- Requires confirmation from other indicators
- Does not predict direction, only volatility
Common Mistakes Beginners Make
//1. Assuming Price Must Reverse at the Bands
Just because price touches a band doesn’t mean it will reverse. In strong trends, price can stay near a band for a long time.
//2. Ignoring Market Context
Bollinger Bands behave differently in trending vs ranging markets. Always identify the market condition first.
//3. Overtrading the Squeeze
Not every squeeze leads to a significant breakout. Wait for confirmation.
//4. Using Wrong Settings
Changing settings too early can lead to confusion. Stick to defaults until you gain experience.
Practical Tips for Using Bollinger Bands
- Always combine with at least one other indicator
- Use higher timeframes for more reliable signals
- Practice on demo accounts before live trading
- Focus on risk management, not just signals
Example Trade Setup
Scenario: Bollinger Bounce in a Range Market
- Identify a sideways market
- Price touches the lower band
- RSI shows oversold condition
- Enter buy trade
- Exit near the middle or upper band
This simple approach can be effective when applied with discipline.
Bollinger Bands in Different Markets
//1. Forex
- Works well due to high liquidity
- Useful for intraday and swing trading
//2. Stocks
- Helps identify volatility around earnings
- Useful for breakout strategies
//3. Cryptocurrency
- Highly volatile market makes Bollinger Bands especially useful
- Frequent squeezes and breakouts
Final Thoughts
Bollinger Bands are one of the most powerful and flexible tools in technical analysis. They provide valuable insights into market volatility, trend strength and potential reversals.
For beginners, the key is not just understanding how Bollinger Bands work, but also knowing when to use them and how to combine them with other indicators.
Start simple, use default settings, and focus on consistency rather than perfection. Over time, you will develop the experience needed to use Bollinger Bands effectively in any market condition.