Introduction
If you're new to trading or investing, you’ve probably come across the term Simple Moving Average (SMA). It’s one of the most widely used technical indicators in financial markets—and for good reason. The SMA helps traders identify trends, smooth out price data and make more informed decisions.
In this complete beginner-friendly guide, we’ll break down everything you need to know about the Simple Moving Average: what it is, how it works, how to calculate it, and how to use it effectively in your trading strategy.
What is a Simple Moving Average (SMA)?
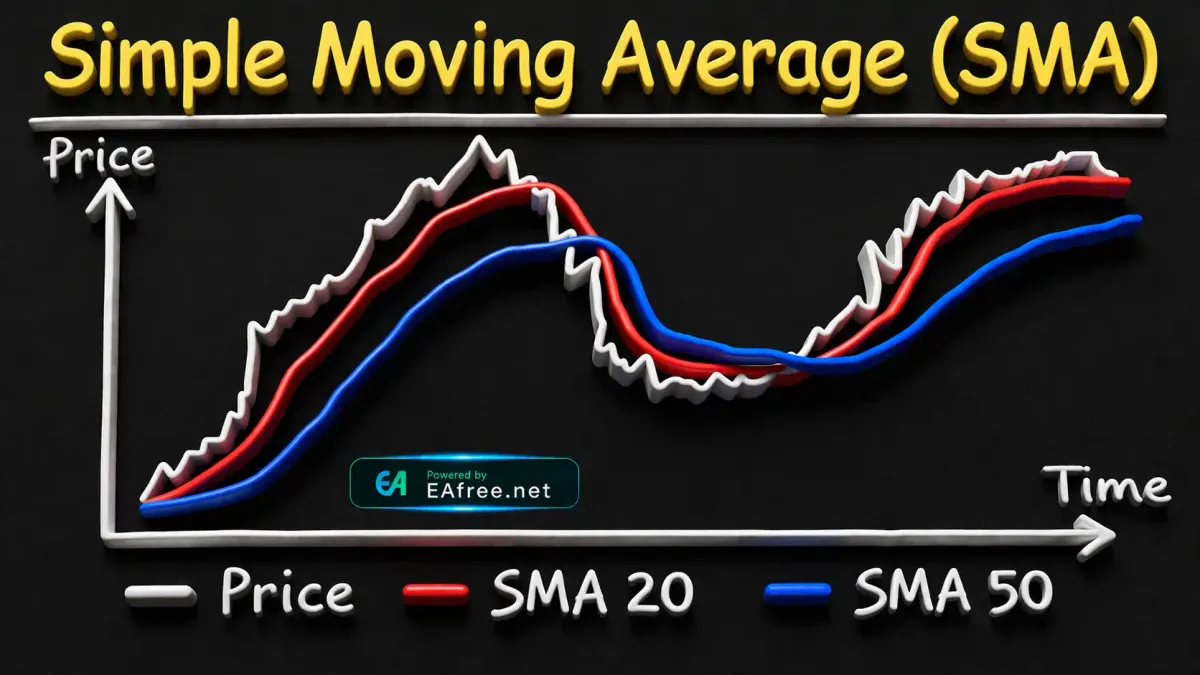
A Simple Moving Average (SMA) is a technical analysis tool that calculates the average price of an asset over a specific period of time. It “moves” because it continuously updates as new price data becomes available.
For example, a 10-day SMA calculates the average closing price of an asset over the last 10 days. Each new day, the oldest data point is removed, and the newest one is added—hence the term moving average.
//Why is SMA important?
The SMA helps traders:
- Identify trends (uptrend, downtrend, sideways)
- Reduce market noise
- Spot potential entry and exit points
- Confirm other technical indicators
How Does SMA Work?
The SMA works by averaging historical prices. It smooths out short-term fluctuations, making it easier to see the overall direction of the market.
//SMA Formula
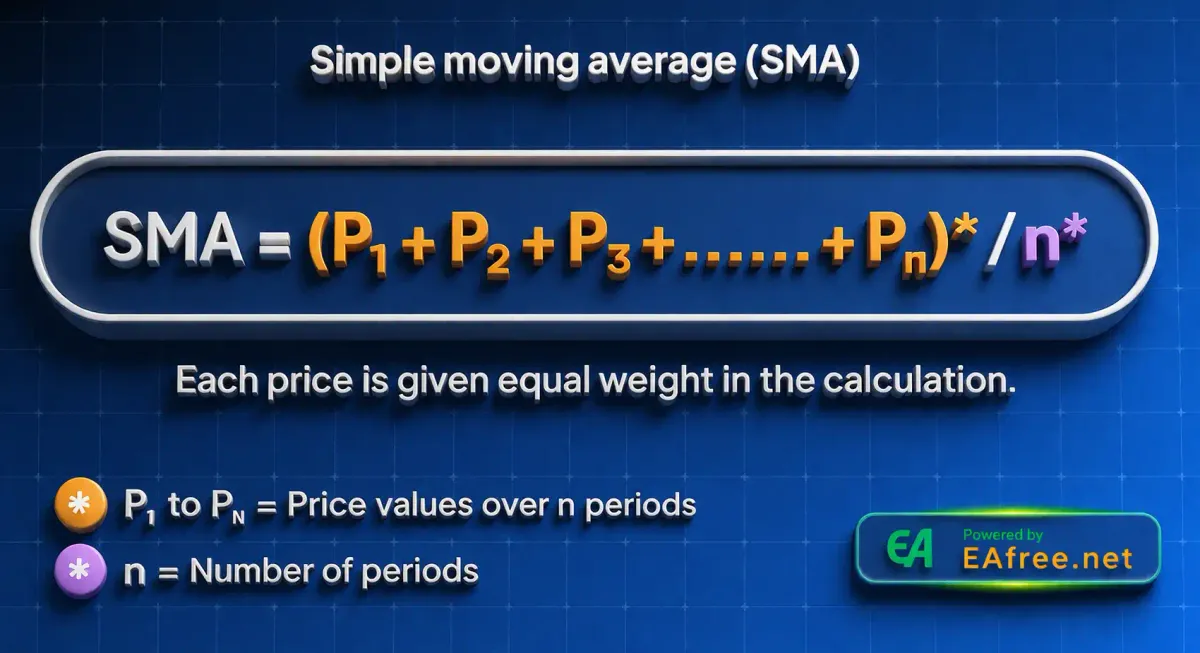
To calculate a Simple Moving Average:
SMA = (P1 + P2 + P3 + ... + Pn) / n
Where:
- P = Price (usually closing price)
- n = Number of periods
//Example
Let’s say you want to calculate a 5-day SMA:
Day 1: $100
Day 2: $102
Day 3: $101
Day 4: $105
Day 5: $107
SMA = (100 + 102 + 101 + 105 + 107) / 5 = 103
The next day, you drop Day 1 and include Day 6, and calculate again.
Types of Moving Averages
While this article focuses on SMA, it’s helpful to understand how it compares to other moving averages.
//1. Simple Moving Average (SMA)
- Equal weight to all data points
- Easy to calculate
- Slower to react to price changes
//2. Exponential Moving Average (EMA)
- Gives more weight to recent prices
- Reacts faster to market changes
- More sensitive to volatility
//3. Weighted Moving Average (WMA)
- Assigns different weights to different data points
- Offers a balance between SMA and EMA
Common SMA Periods Used in Trading
Different SMA periods serve different purposes depending on your trading style.
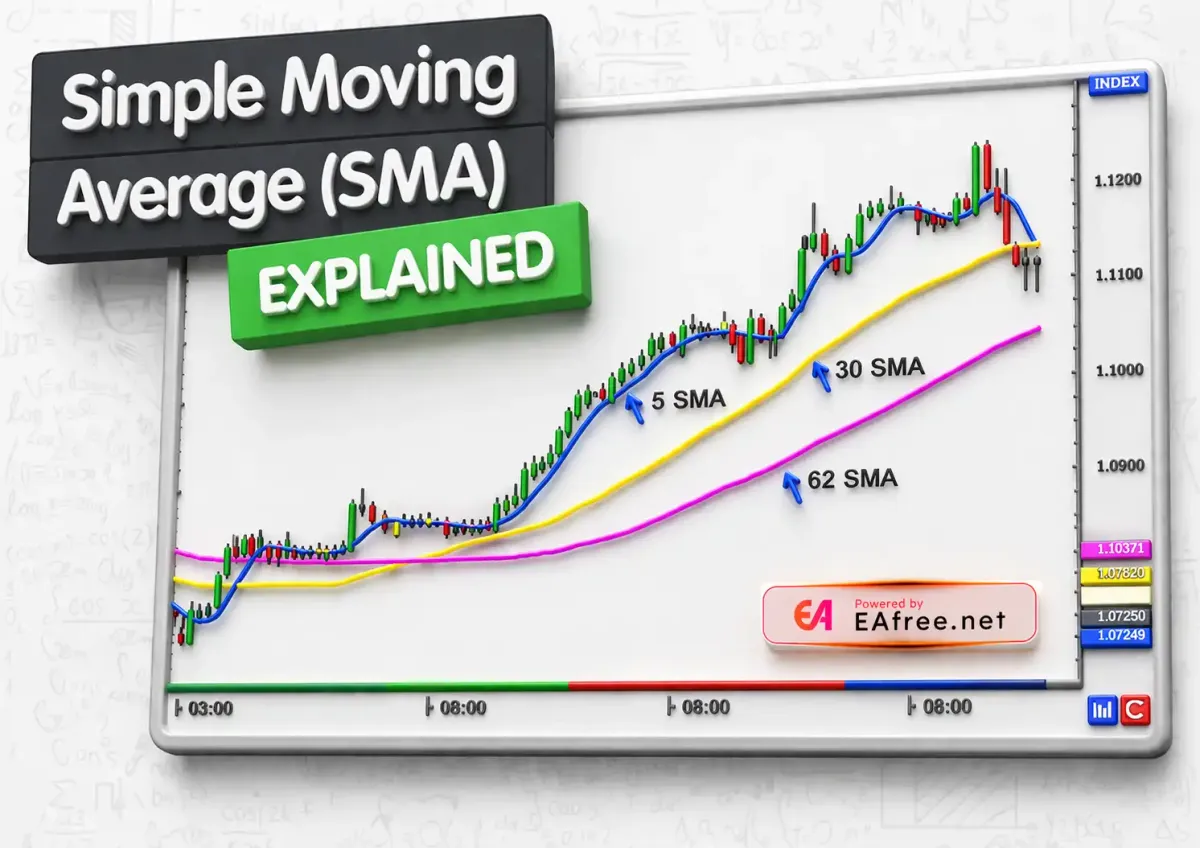
//Short-Term SMAs
- 5-day
- 10-day
- 20-day
Used by day traders and short-term traders to capture quick price movements.
//Medium-Term SMAs
- 50-day
Popular among swing traders to identify medium-term trends.
//Long-Term SMAs
- 100-day
- 200-day
Used by long-term investors to understand the overall market direction.
How to Use SMA in Trading
//1. Identifying Trends
The SMA helps determine whether the market is trending upward, downward, or sideways.
- Price above SMA → Uptrend
- Price below SMA → Downtrend
- Price crossing SMA frequently → Sideways market
//2. Support and Resistance Levels
SMA can act as dynamic support and resistance:
- In an uptrend, SMA often acts as support
- In a downtrend, SMA can act as resistance
//3. SMA Crossover Strategy
One of the most popular SMA strategies is the crossover method.
Golden Cross
- Short-term SMA crosses above long-term SMA
- Indicates a potential bullish trend
Death Cross
- Short-term SMA crosses below long-term SMA
- Indicates a potential bearish trend
Example:
- 50-day SMA crossing above 200-day SMA = bullish signal
//4. Combining SMA with Other Indicators
SMA works best when combined with other tools:
- Relative Strength Index (RSI)
- MACD (Moving Average Convergence Divergence)
- Bollinger Bands
This helps confirm signals and reduce false entries.
Advantages of Using SMA
//1. Simple and Easy to Use
Perfect for beginners with no complex calculations.
//2. Trend Identification
Clearly shows the direction of the market.
//3. Versatile
Can be applied to stocks, forex, crypto, and commodities.
//4. Works on Multiple Timeframes
Useful for day trading, swing trading, and long-term investing.
Disadvantages of SMA
//1. Lagging Indicator
SMA is based on past data, so it reacts slowly to price changes.
//2. False Signals in Sideways Markets
In ranging markets, SMA can generate misleading signals.
//3. Equal Weighting Limitation
All data points are treated equally, which may not reflect recent market conditions accurately.
SMA vs EMA: Which is Better?
There is no “better” indicator—it depends on your trading style.
| Feature | SMA | EMA |
|---|---|---|
| Speed | Slow | Fast |
| Sensitivity | Low | High |
| Best for | Long-term trends | Short-term trading |
//When to use SMA:
- Long-term investing
- Identifying major trends
- Reducing noise
//When to use EMA:
- Short-term trading
- Fast-moving markets
- Early signal detection
Practical Tips for Beginners
//1. Start with Common Periods
Use 50-day and 200-day SMAs for reliable signals.
//2. Don’t Rely on SMA Alone
Always combine with other indicators.
//3. Backtest Your Strategy
Test SMA strategies on historical data before trading live.
//4. Avoid Overcomplicating
Stick to 1–2 moving averages to keep your analysis clear.
Common Mistakes to Avoid
//1. Using Too Many SMAs
This can clutter your chart and cause confusion.
//2. Ignoring Market Context
SMA works differently in trending vs sideways markets.
//3. Blindly Following Crossovers
Always confirm signals with volume or other indicators.
Real-World Example
Imagine a stock is trading above its 200-day SMA. This indicates a strong long-term uptrend. If the price pulls back to the 50-day SMA and bounces, it may present a buying opportunity.
On the other hand, if the price falls below the 200-day SMA, it may signal a bearish trend and a potential exit point.
Conclusion
The Simple Moving Average (SMA) is one of the most essential tools in technical analysis. Its simplicity and effectiveness make it a great starting point for beginners.
While it may not be perfect due to its lagging nature, SMA remains a powerful indicator for identifying trends, spotting entry and exit points, and building a solid trading strategy.
To get the most out of SMA:
- Combine it with other indicators
- Use appropriate timeframes
- Practice with real charts
Mastering SMA is a crucial first step toward becoming a confident and informed trader.