Introduction
In the world of trading and investing, technical indicators play a crucial role in helping traders make informed decisions. One of the most popular and widely used indicators is the Relative Strength Index (RSI). Whether you are trading stocks, forex, or cryptocurrencies, understanding RSI can significantly improve your ability to identify market trends, entry points and potential reversals.
This comprehensive guide will walk you through everything you need to know about RSI—from its basic concept to advanced strategies—so you can confidently incorporate it into your trading toolkit.
What is the Relative Strength Index (RSI)?
The Relative Strength Index (RSI) is a momentum oscillator that measures the speed and magnitude of price movements. It helps traders determine whether an asset is overbought or oversold, indicating potential reversal points.
RSI values range from 0 to 100 and are typically interpreted as follows:
- Above 70 → Overbought (price may decline soon)
- Below 30 → Oversold (price may rise soon)
Developed by J. Welles Wilder Jr. in 1978, RSI has stood the test of time and remains one of the most reliable indicators in technical analysis.
How RSI Works
RSI compares the magnitude of recent gains to recent losses over a specified period, usually 14 periods.
//RSI Formula (Simplified)
RSI is calculated using this formula:

Where:
- RS (Relative Strength) = Average Gain / Average Loss
While you don’t need to calculate RSI manually (trading platforms do it for you), understanding the logic behind it helps you interpret signals more effectively.
Why RSI is Important for Traders
RSI is valuable because it provides insights into:
//1. Market Momentum
It shows whether buyers or sellers are dominating the market.
//2. Overbought and Oversold Conditions
Helps identify when a price might be due for a correction.
//3. Trend Strength
Strong trends often keep RSI in extreme zones longer than expected.
//4. Entry and Exit Points
Traders use RSI to time trades more precisely.
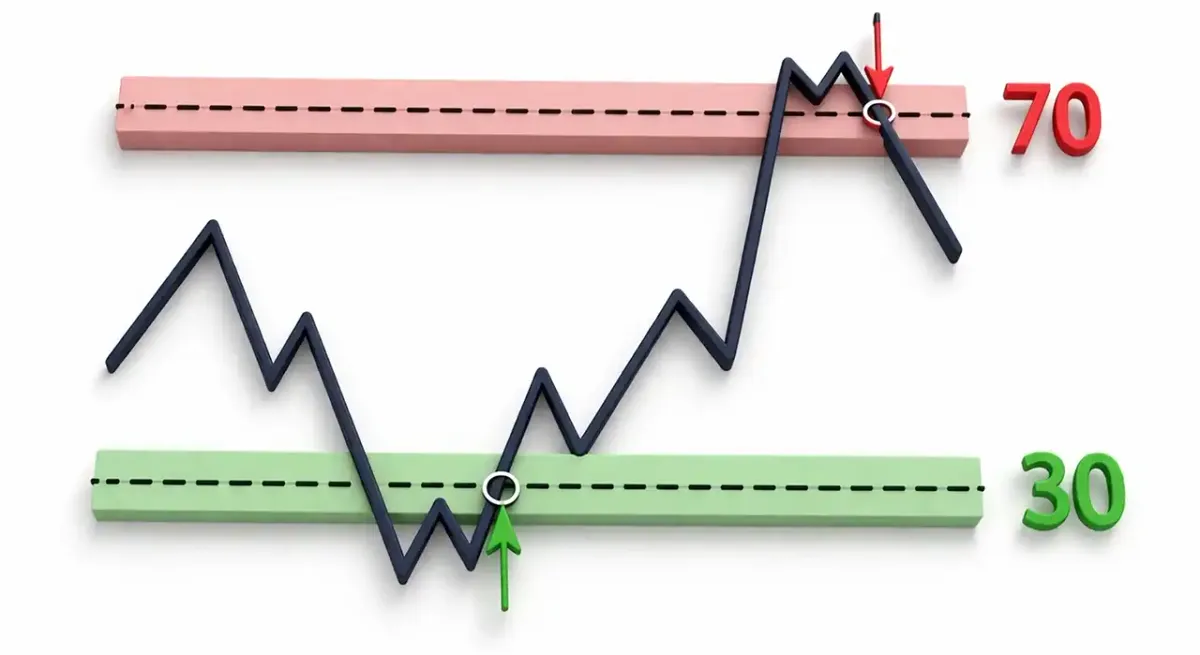
How to Read RSI Correctly
Understanding RSI signals is key to using it effectively.
//Overbought Condition (RSI > 70)
- Indicates strong buying pressure
- Price may be overvalued
- Possible reversal or pullback
//Oversold Condition (RSI < 30)
- Indicates strong selling pressure
- Price may be undervalued
- Potential buying opportunity
⚠️ Important Tip:
RSI does not guarantee reversals. In strong trends, RSI can stay overbought or oversold for extended periods.
RSI Settings: What Works Best?
The default RSI setting is 14 periods, but traders often customize it:
| Setting | Use Case |
|---|---|
| 14 (default) | Balanced signals |
| 7–9 | More sensitive (short-term trading) |
| 21–25 | Smoother signals (long-term trading) |
//Which Should You Use?
- Day traders: Prefer shorter periods (e.g., 9)
- Swing traders: Stick with 14
- Long-term investors: Use longer periods (e.g., 21)
Popular RSI Trading Strategies
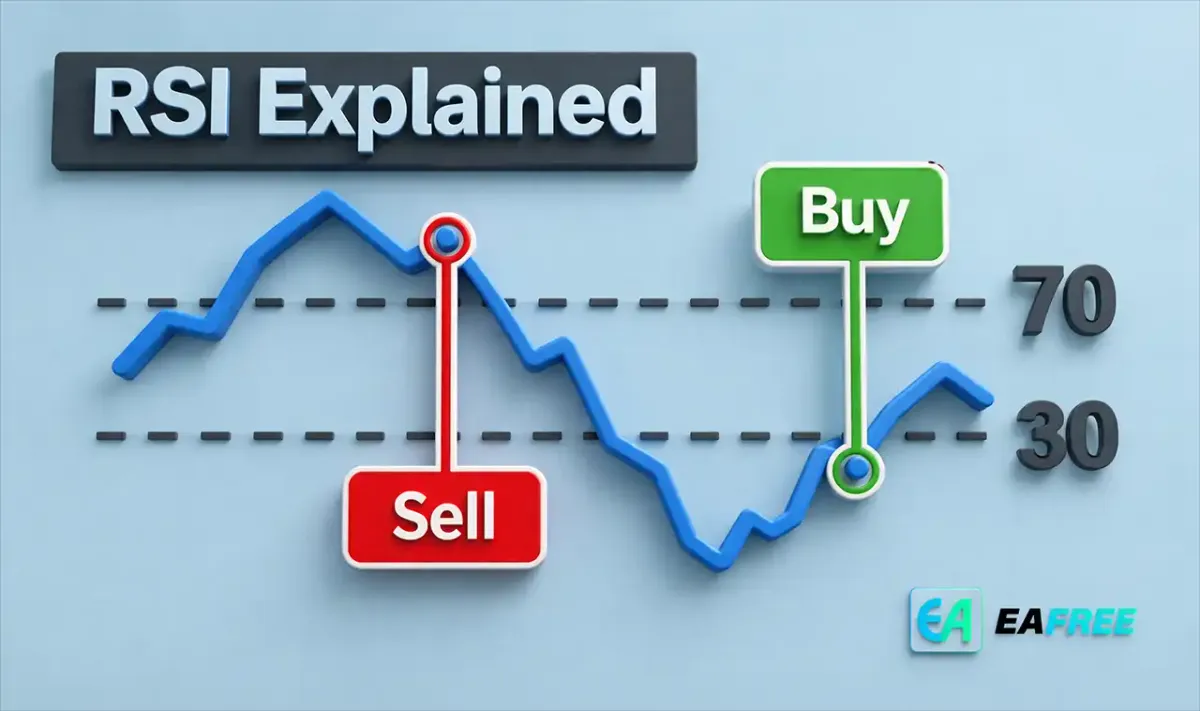
//1. RSI Overbought & Oversold Strategy
This is the simplest and most commonly used method.
Buy Signal:
- RSI drops below 30 and then rises above it
Sell Signal:
- RSI rises above 70 and then falls below it
👉 Best for range-bound markets
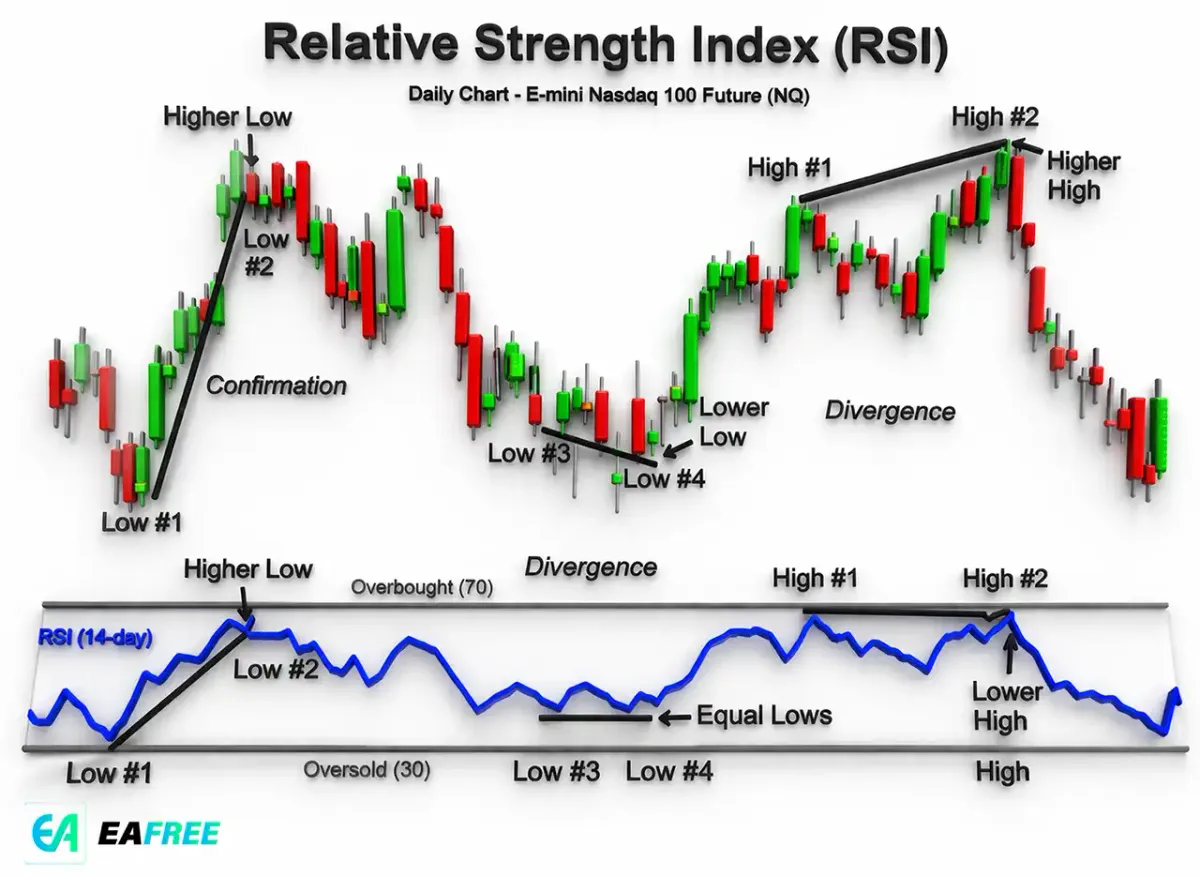
//2. RSI Divergence Strategy
Divergence occurs when price and RSI move in opposite directions.
Bullish Divergence
- Price makes lower lows
- RSI makes higher lows
→ Signals potential upward reversal
Bearish Divergence
- Price makes higher highs
- RSI makes lower highs
→ Signals potential downward reversal
👉 One of the most powerful RSI signals
//3. RSI Trend Confirmation
In strong trends, RSI behaves differently:
- Uptrend: RSI stays between 40–80
- Downtrend: RSI stays between 20–60
👉 Use RSI to confirm trend strength rather than reversal
//4. RSI 50 Level Strategy
The midpoint (50) acts as a trend indicator:
- RSI above 50 → Bullish momentum
- RSI below 50 → Bearish momentum
👉 Useful for trend-following strategies
Combining RSI with Other Indicators
RSI becomes even more powerful when combined with other tools.
//1. RSI + Moving Averages (MA)
- Use moving averages to identify trend
- Use RSI to find entry points
//2. RSI + Support and Resistance
- Buy near support when RSI is oversold
- Sell near resistance when RSI is overbought
//3. RSI + MACD
- Confirm signals with both indicators
- Reduces false signals
Common Mistakes Beginners Make
//1. Relying Only on RSI
RSI should not be used alone. Always confirm with other indicators or price action.
//2. Misinterpreting Overbought/Oversold
Overbought doesn’t always mean “sell,” and oversold doesn’t always mean “buy.”
//3. Ignoring Market Trends
RSI behaves differently in trending vs. ranging markets.
//4. Using Wrong Timeframe
Signals vary across timeframes. Align RSI with your trading style.
RSI in Different Markets
//Stock Market
- Works well for swing trading
- Helps identify pullbacks in trends
//Forex Market
- Effective in ranging conditions
- Combine with support/resistance
//Cryptocurrency
- Useful but more volatile
- Expect more false signals
Advanced RSI Techniques
//1. RSI Swing Rejection
A more refined strategy involving four steps:
- RSI enters overbought/oversold zone
- RSI exits the zone
- RSI pulls back without re-entering
- RSI breaks previous level
👉 Indicates strong reversal signals
//2. RSI Trendlines
You can draw trendlines directly on RSI:
- Breakouts on RSI often occur before price
- Helps predict early moves
//3. Multi-Timeframe RSI Analysis
Check RSI across different timeframes:
- Higher timeframe → overall trend
- Lower timeframe → entry points
Pros and Cons of RSI
//Advantages
✔ Easy to understand
✔ Works across all markets
✔ Helps identify reversals
✔ Useful for beginners
//Disadvantages
✘ Can give false signals
✘ Less effective in strong trends
✘ Requires confirmation
Practical Example
Imagine a stock showing the following:
- RSI drops to 25 → Oversold
- Price reaches strong support
- RSI turns upward
👉 This combination increases the probability of a successful buy trade.
Best Tips for Using RSI Effectively
- Always combine RSI with other indicators.
- Use proper risk management.
- Avoid overtrading based on RSI alone.
- Practice on a demo account first.
- Adapt RSI settings to your strategy.
Conclusion
The Relative Strength Index (RSI) is a powerful and versatile tool that every trader should understand. It helps identify momentum, detect potential reversals, and improve entry and exit timing.
However, like any indicator, RSI is not foolproof. The key to success lies in combining it with other tools, understanding market context and practicing disciplined trading.
If you are just starting out, begin with the default settings, test strategies in different market conditions, and gradually refine your approach. Over time, RSI can become a core part of your trading strategy.