Introduction
If you're stepping into the world of financial markets—whether it's stocks, forex, or cryptocurrencies—you’ll quickly encounter the term Moving Averages (MA). This powerful yet simple indicator is one of the most widely used tools in technical analysis. It helps traders and investors identify trends, smooth price data, and make more informed decisions.
In this ultimate beginner’s guide, we’ll break down everything you need to know about Moving Averages—from the basics to practical strategies you can start using today.
What is a Moving Average (MA)?
A Moving Average (MA) is a technical indicator that calculates the average price of an asset over a specific period of time. As new price data becomes available, the average “moves,” hence the name.
Instead of focusing on short-term price fluctuations, moving averages help traders identify the overall direction of a trend.
//Why Use Moving Averages?
- Smooth out price noise
- Identify trends (uptrend, downtrend, sideways)
- Provide dynamic support and resistance levels
- Generate buy and sell signals
Types of Moving Averages
There are several types of moving averages, but the two most popular ones are:
//1. Simple Moving Average (SMA)
The Simple Moving Average (SMA) calculates the average price over a set number of periods.
Formula:
SMA = (P1 + P2 + ... + Pn) / n
Where:
- P = price
- n = number of periods
Example:
A 10-day SMA adds the closing prices of the last 10 days and divides by 10.
Pros:
- Easy to understand
- Smooth and stable
Cons:
- Slow to react to price changes
//2. Exponential Moving Average (EMA)
The Exponential Moving Average (EMA) gives more weight to recent prices, making it more responsive.
Pros:
- Faster reaction to market changes
- Better for short-term trading
Cons:
- More sensitive to noise
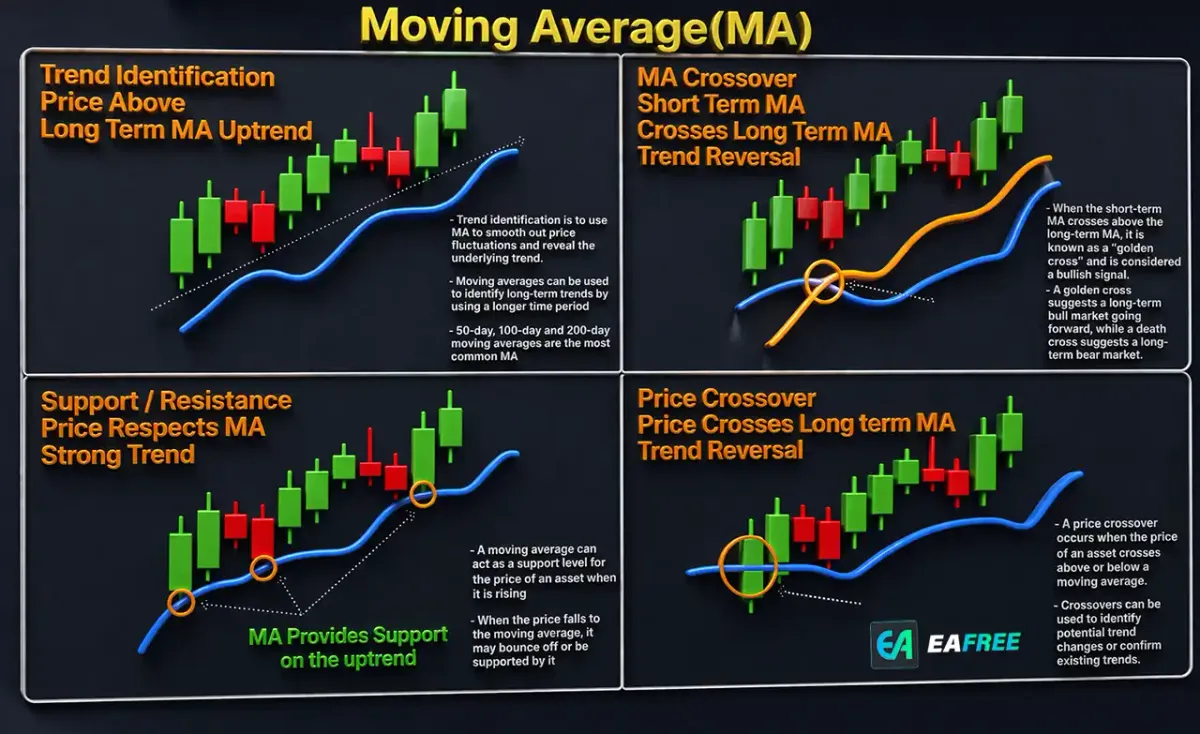
How Moving Averages Work
Moving averages are plotted as lines on a price chart. As price changes, the MA line adjusts accordingly.
- When price is above the MA → Uptrend
- When price is below the MA → Downtrend
- When price moves sideways → Consolidation
Common Moving Average Periods
Different traders use different MA periods depending on their strategy:
- Short-term: 5, 10, 20 periods
- Medium-term: 50 periods
- Long-term: 100, 200 periods
The 200-day moving average is especially popular and often used to identify long-term trends.
Moving Average Strategies
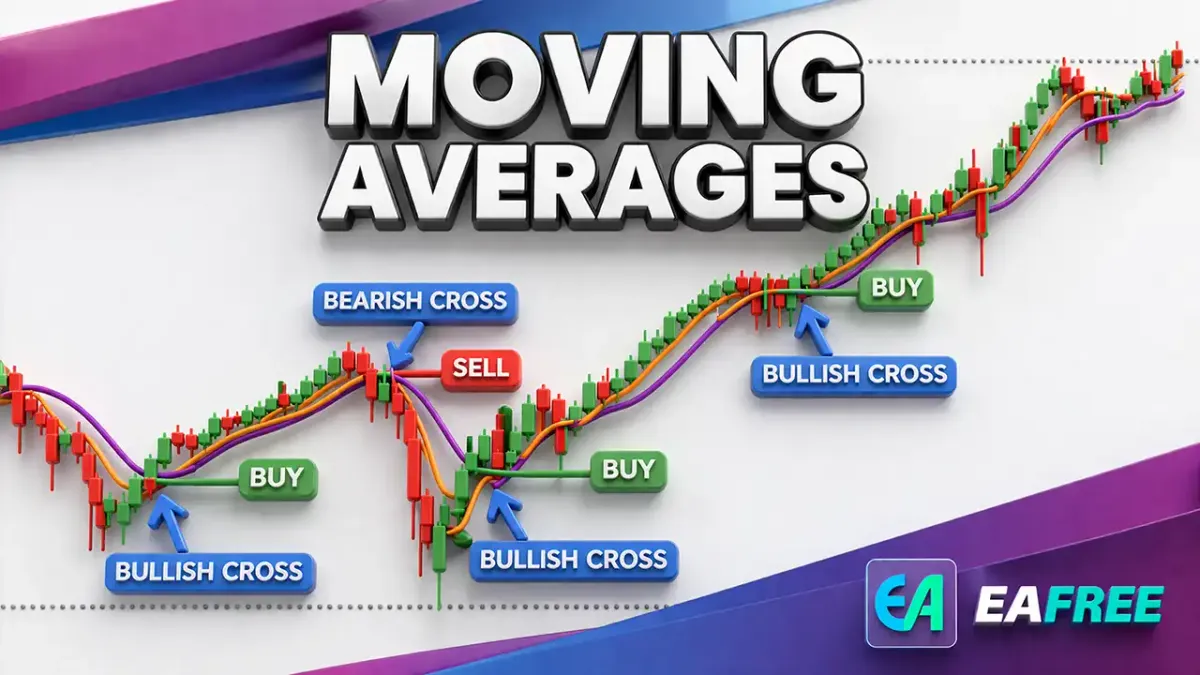
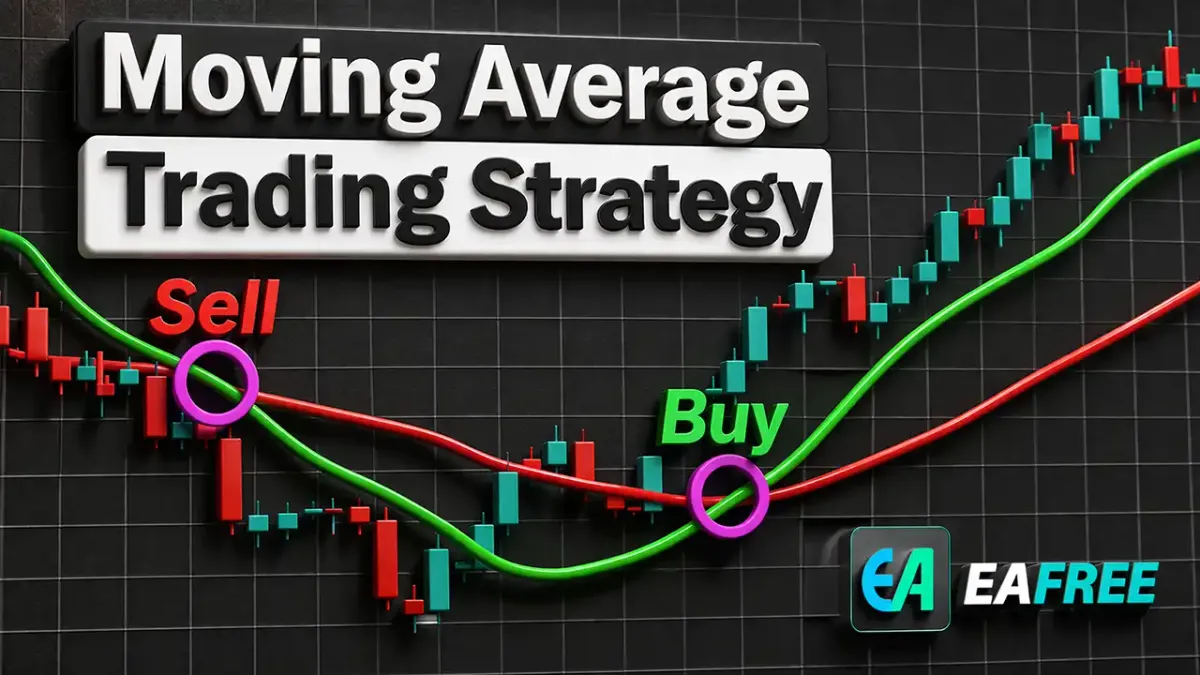
//1. Moving Average Crossover Strategy
This is one of the most popular strategies.
How it works:
- Use two MAs (e.g., 50-day and 200-day)
- Buy when the short MA crosses above the long MA (Golden Cross)
- Sell when the short MA crosses below the long MA (Death Cross)
Why it works:
It signals potential trend reversals.
//2. Price Crossover Strategy
Buy Signal:
When price crosses above the moving average
Sell Signal:
When price crosses below the moving average
This strategy is simple and beginner-friendly.
//3. Dynamic Support and Resistance
Moving averages often act as support and resistance levels.
- In an uptrend → MA acts as support
- In a downtrend → MA acts as resistance
Advantages of Using Moving Averages
- Simple and easy to use
- Works across all markets (stocks, forex, crypto)
- Helps identify trends clearly
- Can be combined with other indicators
Limitations of Moving Averages
While useful, moving averages are not perfect.
- Lagging indicator: Based on past data
- Can give false signals in sideways markets
- Not ideal for predicting sudden price movements
Best Practices for Beginners
If you're just starting out, here are some tips:
//1. Combine with Other Indicators
Use MA with indicators like:
//2. Choose the Right Timeframe
Short-term traders prefer EMA, while long-term investors often use SMA.
//3. Avoid Overcomplication
Stick to 1–2 moving averages to keep your strategy simple.
Moving Averages in Different Markets
//Stock Market
Used to identify long-term trends and entry points.
//Forex Market
Popular for short-term trading and scalping strategies.
//Cryptocurrency
Helps navigate volatile markets and identify trends.
Practical Example
Imagine a stock trading above its 50-day and 200-day moving averages. This indicates a strong uptrend. If the 50-day MA crosses above the 200-day MA, traders may see this as a strong buy signal.
Conclusion
Moving Averages are one of the most essential tools in technical analysis. Whether you're a beginner or an experienced trader, understanding how to use them effectively can significantly improve your trading decisions.
Start simple—experiment with SMA and EMA, test different timeframes, and gradually build your own strategy. Remember, no indicator is perfect, but when used correctly, Moving Averages can give you a powerful edge in the market.