Introduction
If you are new to trading, you’ve probably heard about technical indicators that help predict market movements. One of the most popular and beginner-friendly tools is the Stochastic Oscillator. Despite its intimidating name, this indicator is relatively simple to understand and can significantly improve your trading decisions when used correctly.
In this complete guide, we will break down everything you need to know about the Stochastic Oscillator—from how it works to practical strategies you can start using today. By the end of this article, you’ll have a solid foundation to confidently apply this tool in your trading journey.
What Is the Stochastic Oscillator?
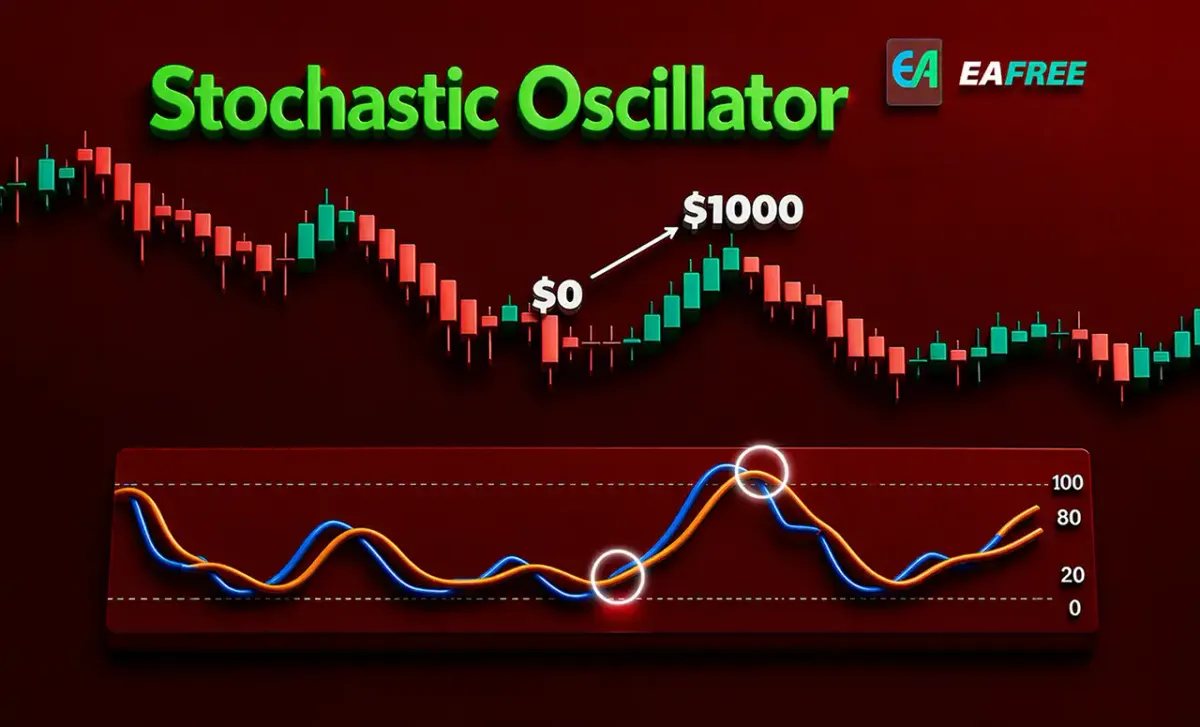
The Stochastic Oscillator is a momentum indicator that compares the closing price of an asset to its price range over a specific period of time. It helps traders determine whether an asset is overbought or oversold, signaling potential trend reversals.
The indicator moves between 0 and 100, making it easy to interpret:
- Above 80 → Overbought (price may fall soon)
- Below 20 → Oversold (price may rise soon)
It was developed by George Lane in the 1950s and remains widely used in stocks, forex and cryptocurrency markets.
How Does the Stochastic Oscillator Work?
The core idea behind the Stochastic Oscillator is simple:
In an uptrend, prices tend to close near their highs.
In a downtrend, prices tend to close near their lows.
The indicator measures this behavior and converts it into a visual signal.
//Key Components
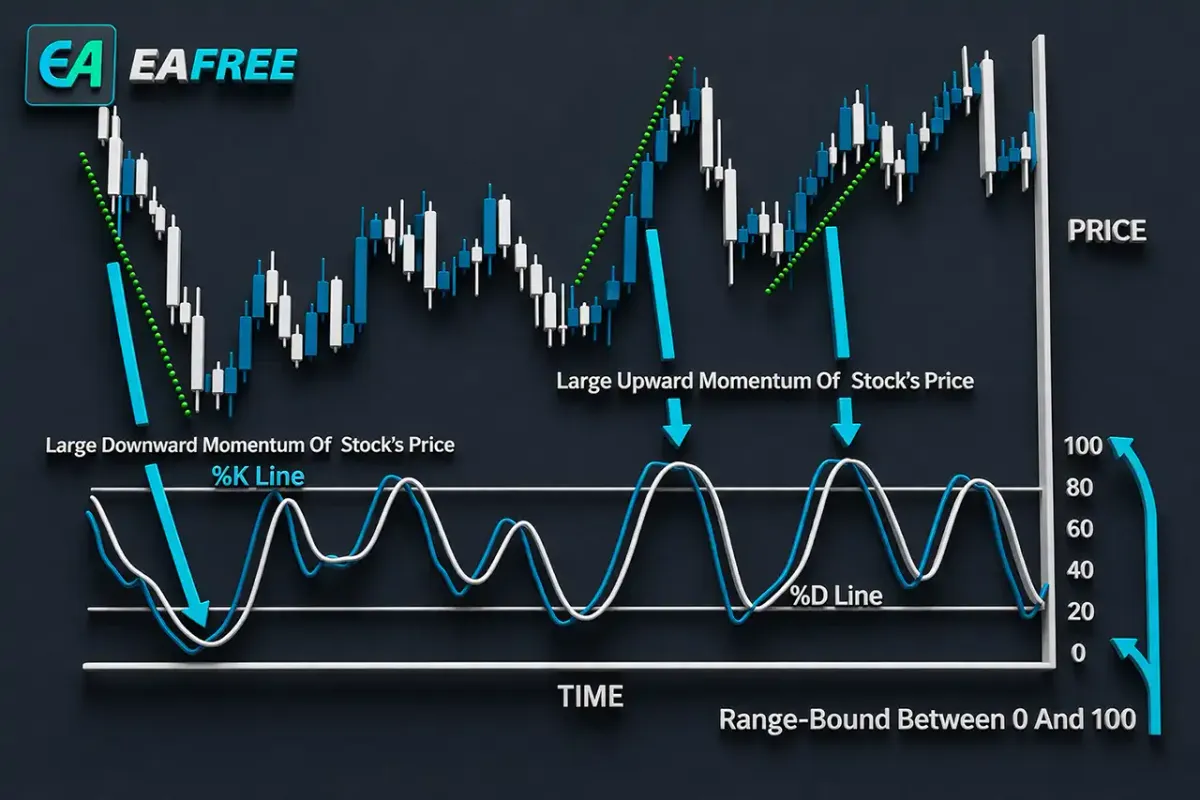
The Stochastic Oscillator consists of two lines:
- %K line: The main line (faster and more sensitive)
- %D line: A moving average of %K (smoother and slower)
//Basic Formula
While you don’t need to memorize the formula, understanding it helps:
%K = (Current Close - Lowest Low) / (Highest High - Lowest Low) × 100
This calculation is typically based on a 14-period timeframe.
Why Traders Use the Stochastic Oscillator
The Stochastic Oscillator is popular because it provides clear and actionable signals. Here are the main reasons traders rely on it:
//1. Identifying Overbought and Oversold Conditions
This is the most common use. When the indicator reaches extreme levels, it suggests a potential reversal.
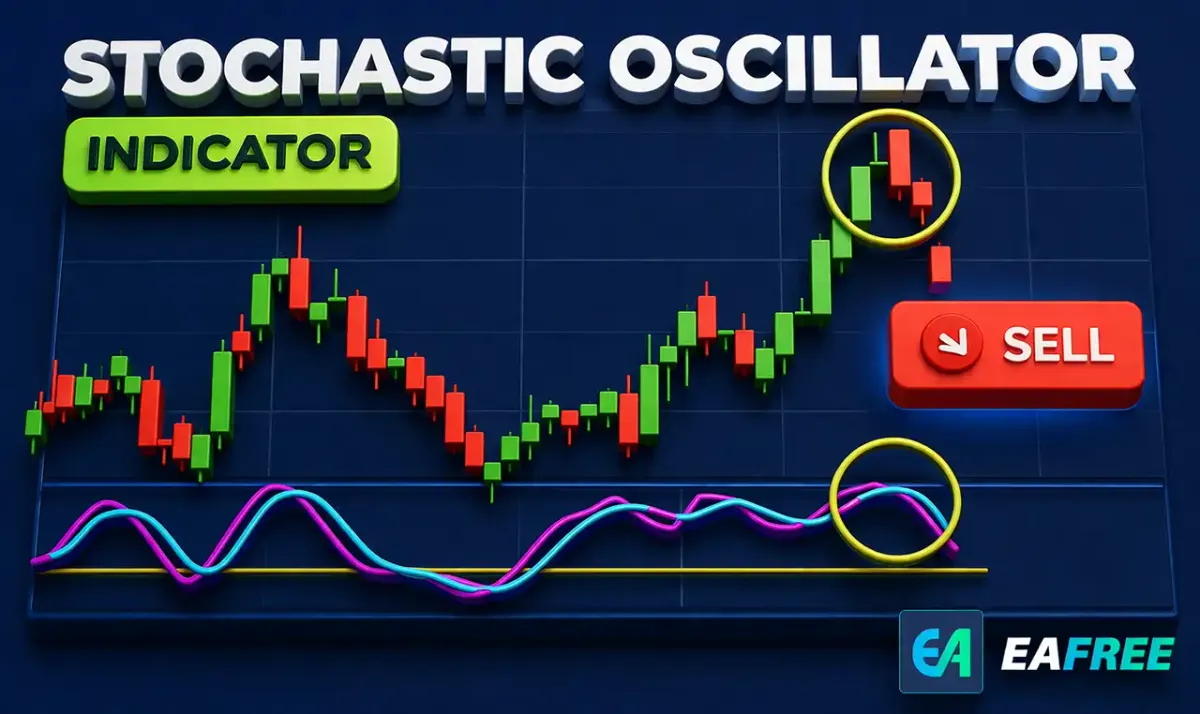
- Above 80 → Possible selling opportunity
- Below 20 → Possible buying opportunity
//2. Spotting Trend Reversals
The oscillator can signal when momentum is weakening, even before price changes direction.
//3. Confirming Trends
Traders often use it alongside other indicators to confirm whether a trend is strong or losing steam.
How to Read the Stochastic Oscillator
Understanding how to interpret the indicator is key to using it effectively.
//Overbought and Oversold Levels
- 80–100 range: Market is overbought
- 0–20 range: Market is oversold
However, keep in mind:
Overbought doesn’t always mean the price will immediately drop—and oversold doesn’t always mean it will rise.
//Crossovers
One of the most important signals comes from the crossover between %K and %D:
- Bullish signal: %K crosses above %D
- Bearish signal: %K crosses below %D
These crossovers are stronger when they occur in overbought or oversold zones.
Types of Stochastic Oscillator
There are three main variations:
//1. Fast Stochastic
- Very sensitive to price changes
- Generates more signals (but also more false ones)
//2. Slow Stochastic
- Applies smoothing to reduce noise
- More reliable for beginners
//3. Full Stochastic
- Fully customizable
- Allows traders to adjust sensitivity
For beginners, the Slow Stochastic is usually the best starting point.
Best Settings for Beginners
The most commonly used settings are:
- %K period: 14
- %D period: 3
- Slowing: 3
These default settings work well in most markets and timeframes. As you gain experience, you can experiment with different configurations.
Trading Strategies Using the Stochastic Oscillator
Now let’s explore some practical strategies you can apply immediately.
//1. Overbought/Oversold Strategy
How it works:
- Buy when the indicator falls below 20 and then crosses back above
- Sell when it rises above 80 and then crosses back below
Why it works:
This strategy targets potential reversals when the market is stretched.
//2. Crossover Strategy
How it works:
- Buy when %K crosses above %D
- Sell when %K crosses below %D
Tip:
Combine this with overbought/oversold zones for stronger signals.
//3. Divergence Strategy
Divergence occurs when price and the indicator move in opposite directions.
Types:
- Bullish divergence: Price makes lower lows, but indicator makes higher lows
- Bearish divergence: Price makes higher highs, but indicator makes lower highs
Why it matters:
Divergence often signals a trend reversal before it happens.
//4. Trend Confirmation Strategy
Instead of using the indicator alone, combine it with trend analysis:
- In an uptrend → Focus on buy signals
- In a downtrend → Focus on sell signals
This helps filter out false signals.
Common Mistakes Beginners Make
Even though the Stochastic Oscillator is simple, many beginners misuse it. Avoid these common pitfalls:
//1. Trading Every Signal
Not every crossover or overbought/oversold signal is reliable. Always confirm with other tools.
//2. Ignoring the Trend
The biggest mistake is trading against the trend. The oscillator works best when aligned with the overall market direction.
//3. Using It Alone
Relying solely on one indicator can be risky. Combine it with:
- Support and resistance levels
- Moving averages
- Price action
Tips for Using the Stochastic Oscillator Effectively
To get the most out of this indicator, follow these practical tips:
//1. Combine with Other Indicators
Use it alongside tools like RSI or moving averages to confirm signals.
//2. Adjust Settings for Different Markets
Shorter settings for fast markets (like crypto), longer settings for slower markets (like stocks).
//3. Practice on a Demo Account
Before risking real money, test your strategies in a simulated environment.
//4. Focus on Higher Timeframes
Signals on higher timeframes (like 4H or daily charts) are generally more reliable than those on lower timeframes.
Advantages and Disadvantages
//Advantages
- Easy to understand and use
- Works in multiple markets
- Provides clear buy/sell signals
- Great for identifying reversals
//Disadvantages
- Can produce false signals in strong trends
- Not effective when used alone
- Requires confirmation from other tools
When Should You Use the Stochastic Oscillator?
The Stochastic Oscillator works best in:
- Range-bound markets (sideways movement)
- Markets with clear support and resistance levels
It is less effective in strong trending markets unless combined with other indicators.
Final Thoughts
The Stochastic Oscillator is one of the best tools for beginner traders. It offers a simple yet powerful way to understand market momentum and identify potential entry and exit points.
However, like any trading tool, it is not perfect. The key to success is learning how to combine it with other strategies and using proper risk management.
If you are just starting out, focus on mastering the basics:
- Understand overbought and oversold levels
- Learn how crossovers work
- Practice identifying divergence
With time and experience, you’ll be able to use the Stochastic Oscillator confidently and effectively in your trading strategy.