Introduction
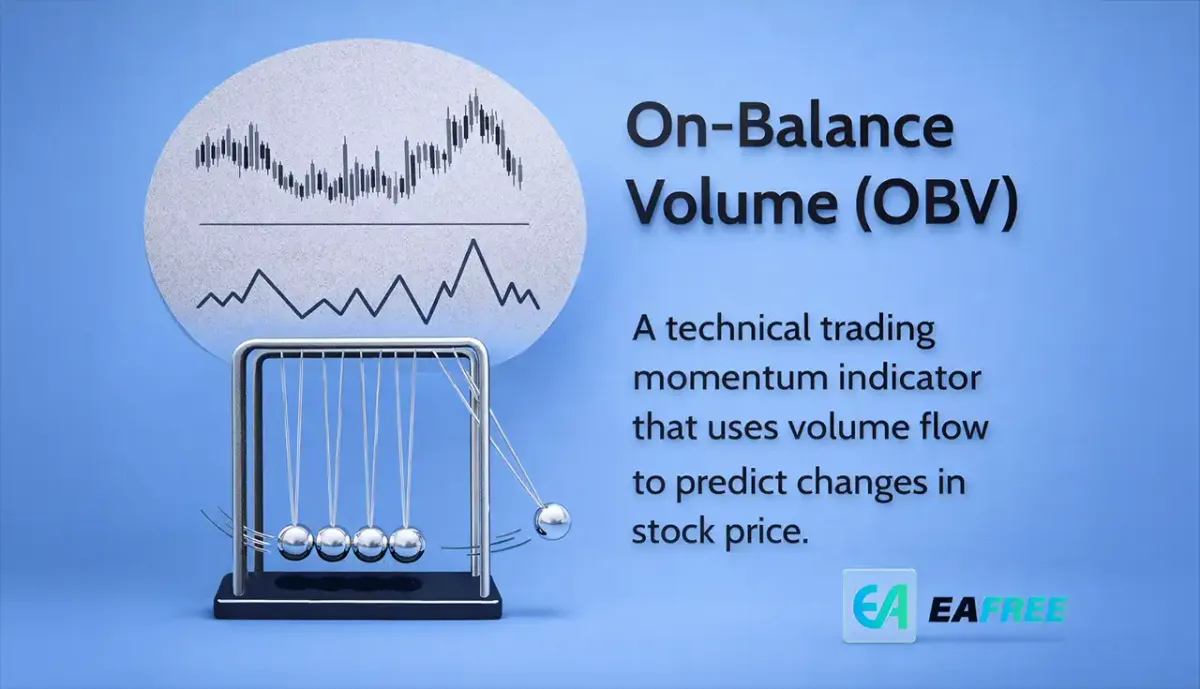
In the world of trading, understanding market momentum is just as important as analyzing price movements. While many beginners focus solely on charts and candlestick patterns, experienced traders know that volume plays a critical role in confirming trends. One of the most powerful yet simple indicators for tracking volume is On-Balance Volume (OBV).
Originally developed by Joseph Granville, OBV helps traders determine whether money is flowing into or out of an asset. This insight can provide early signals of potential price movements—often before they become visible on the chart.
In this beginner-friendly guide, we’ll break down what OBV is, how it works, and how you can use it to improve your trading decisions.
What is On-Balance Volume (OBV)?
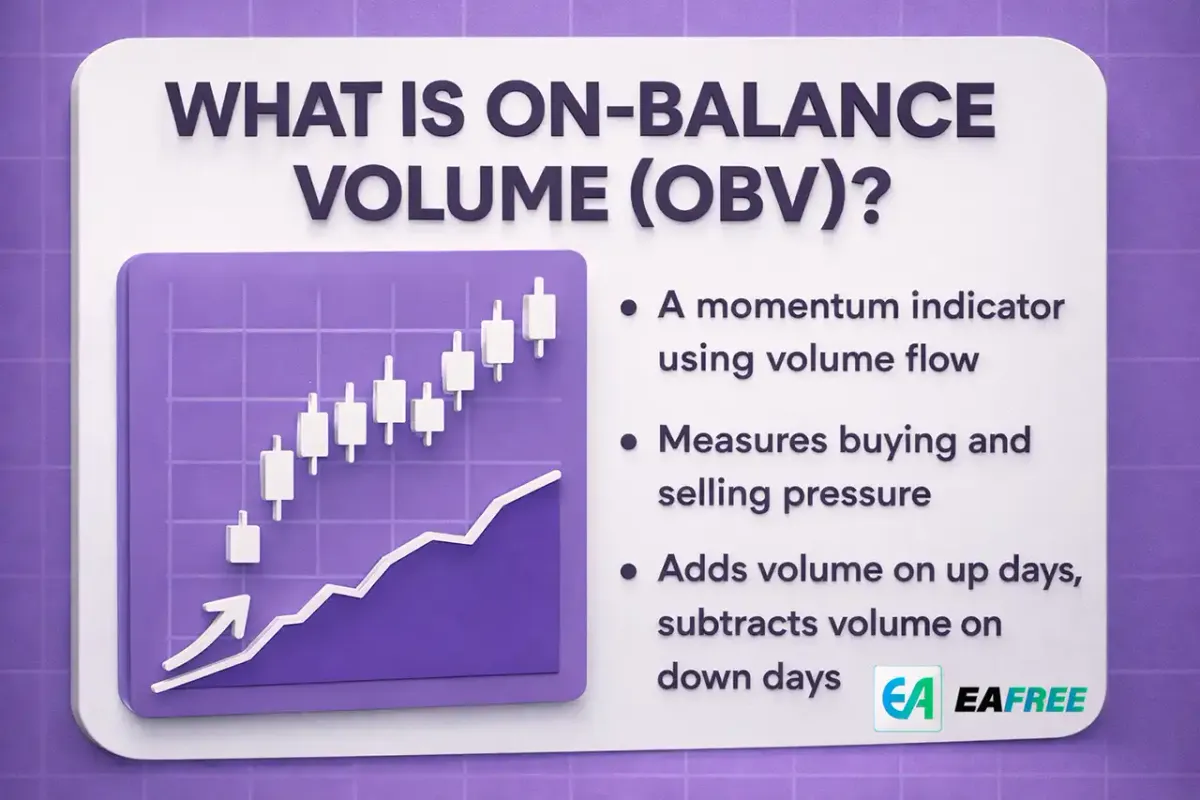
On-Balance Volume (OBV) is a momentum indicator that uses trading volume to predict price changes. It works on a simple principle:
Volume precedes price.
This means that when volume increases significantly, a price movement is likely to follow.
OBV tracks cumulative volume by adding or subtracting each day’s trading volume depending on whether the price closes higher or lower than the previous day.
How OBV Works
The calculation of OBV is straightforward:
- If today’s closing price is higher than yesterday’s → Add today’s volume
- If today’s closing price is lower than yesterday’s → Subtract today’s volume
- If prices are unchanged → OBV stays the same
This creates a running total that reflects buying and selling pressure.
//Example:
- Day 1: OBV = 0
- Day 2 (price up): OBV = 0 + volume
- Day 3 (price down): OBV = previous OBV - volume
Over time, this line forms a trend that traders can analyze alongside price charts.
Why OBV Matters in Trading
OBV is powerful because it reveals what price alone cannot:
//1. Detecting Smart Money Movement
Large institutional investors often accumulate positions quietly. OBV can help identify this accumulation before prices spike.
//2. Confirming Trends
If price and OBV move in the same direction, the trend is considered strong and reliable.
//3. Spotting Reversals Early
Divergences between price and OBV can signal upcoming trend reversals.
Key OBV Trading Signals
//1. Trend Confirmation
When OBV is rising along with price, it indicates strong buying pressure.
- Bullish signal: Price ↑ + OBV ↑
- Bearish signal: Price ↓ + OBV ↓
This alignment confirms that the trend is supported by volume.
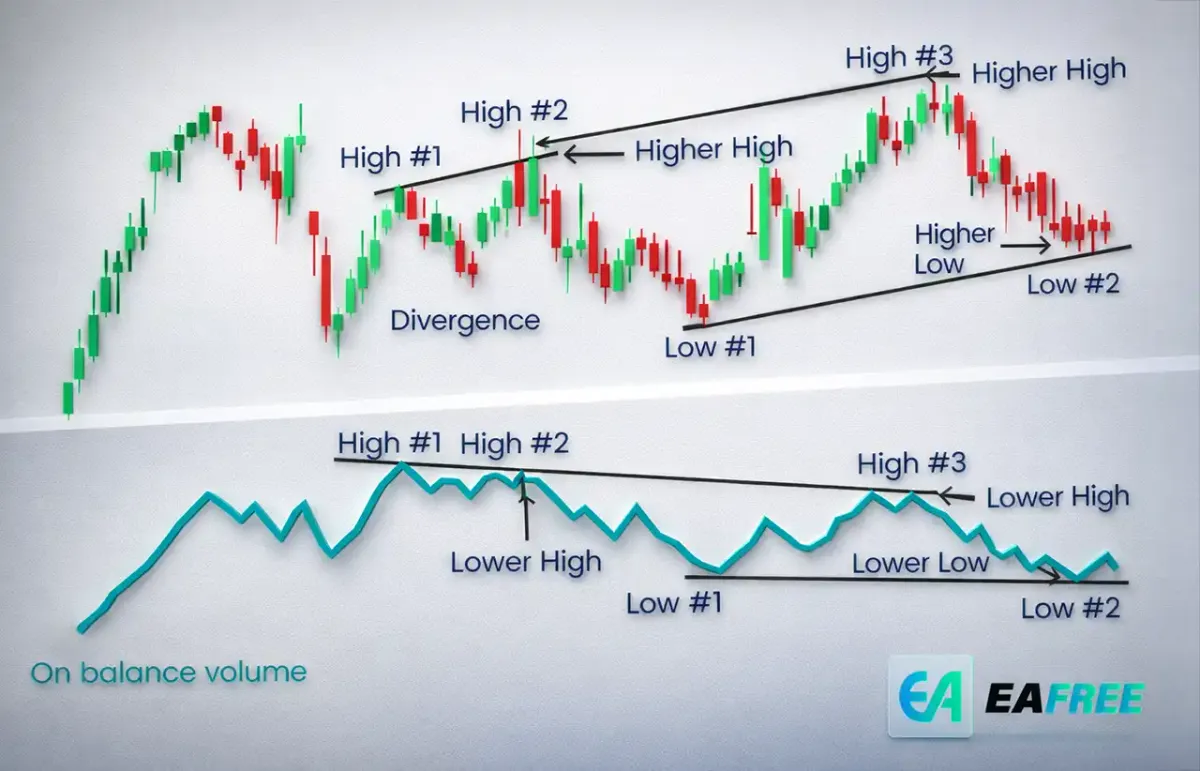
//2. Divergence (Very Important)
Divergence occurs when price and OBV move in opposite directions.
Bullish Divergence:
- Price is falling
- OBV is rising
👉 Indicates accumulation → potential price increase
Bearish Divergence:
- Price is rising
- OBV is falling
👉 Indicates distribution → potential price drop
Divergence is one of the most valuable signals OBV provides.
//3. Breakouts Confirmation
OBV can help validate breakouts:
- If price breaks resistance and OBV also spikes → Strong breakout
- If price breaks resistance but OBV is flat → Weak breakout (possible fakeout)
How to Use OBV in Your Trading Strategy
//Step 1: Add OBV to Your Chart
Most trading platforms like TradingView, MetaTrader, or Binance provide OBV as a built-in indicator.
//Step 2: Identify the Trend
Look at whether OBV is generally trending upward or downward.
//Step 3: Compare with Price Action
Check if OBV confirms the price movement.
//Step 4: Look for Divergence
This is where OBV shines. Watch carefully for mismatches between price and volume trends.
Practical Example
Imagine a stock that has been steadily rising. However, OBV starts to flatten or decline.
👉 This suggests that fewer traders are supporting the upward move.
Even though price looks strong, the trend may soon reverse.
Advantages of OBV
//✔ Simple to Understand
OBV is beginner-friendly and easy to interpret.
//✔ Leading Indicator
It can provide signals before price changes become obvious.
//✔ Works Across Markets
OBV is effective in stocks, crypto, forex and commodities.
Limitations of OBV
//✖ Not Always Accurate
Like any indicator, OBV can give false signals.
//✖ No Exact Entry/Exit Points
OBV is better for confirmation than precise timing.
//✖ Sensitive to Volume Spikes
Sudden large volume events can distort the indicator.
Best Practices When Using OBV
To maximize effectiveness, follow these tips:
//1. Combine with Other Indicators
Use OBV alongside:
- Moving Averages (MA)
- Relative Strength Index (RSI)
- MACD
This helps reduce false signals.
//2. Focus on Trends, Not Single Moves
OBV works best when analyzing overall direction rather than short-term fluctuations.
//3. Use Higher Timeframes
Signals are more reliable on daily or weekly charts compared to very short timeframes.
OBV vs Other Volume Indicators
//OBV vs Volume Bars
- Volume bars show raw volume
- OBV shows directional flow (more insightful)
//OBV vs Accumulation/Distribution (A/D)
- OBV is simpler
- A/D considers price range within a candle
Both are useful, but OBV is more beginner-friendly.
Common Mistakes Beginners Make
//❌ Relying Only on OBV
Never trade based on OBV alone.
//❌ Ignoring Market Context
Always consider overall market trends and news.
//❌ Overtrading Divergences
Not all divergences lead to reversals—wait for confirmation.
Conclusion
On-Balance Volume (OBV) is a powerful tool that helps traders understand the relationship between volume and price movement. By tracking buying and selling pressure, OBV can provide early insights into trend strength and potential reversals.
For beginners, OBV offers a simple yet effective way to enhance trading strategies without overwhelming complexity. While it shouldn’t be used in isolation, combining OBV with other indicators can significantly improve your decision-making.