The Average Directional Index (ADX) is one of the most widely used technical indicators in trading. Whether you’re a beginner or an experienced trader, understanding how to measure trend strength can significantly improve your decision-making. In this guide, we’ll break down everything you need to know about ADX in a simple, practical, and beginner-friendly way.
What Is the Average Directional Index (ADX)?
The Average Directional Index (ADX) is a technical analysis indicator used to measure the strength of a trend. It does not indicate the direction of the trend (up or down), but rather how strong the trend is.
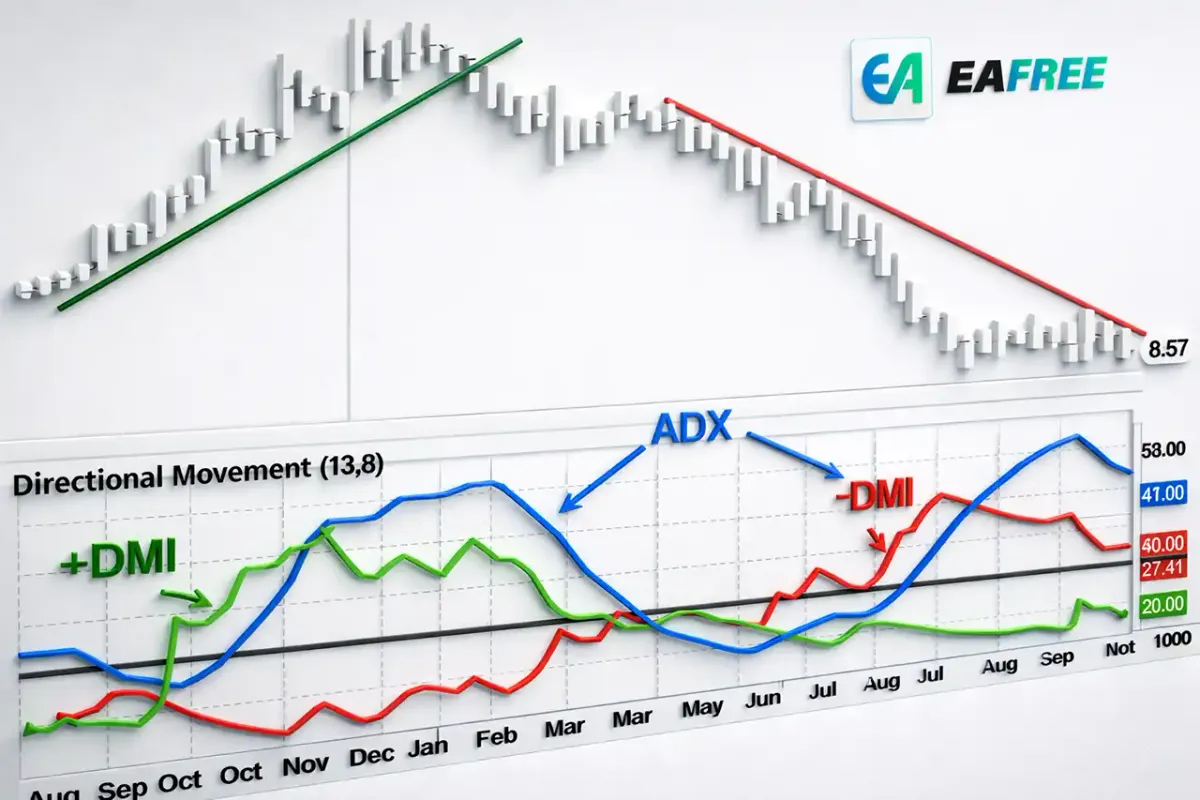
The ADX is part of a system developed by J. Welles Wilder Jr., which also includes two other indicators:
- +DI (Positive Directional Indicator)
- -DI (Negative Directional Indicator)
Together, these components help traders identify both the strength and direction of a trend.
Key takeaway:
- ADX tells you how strong a trend is
- +DI and -DI tell you the direction of the trend
Why Is ADX Important in Trading?
Many traders struggle not because they can’t identify direction, but because they don’t know whether a trend is strong enough to trade.
This is where ADX becomes extremely valuable.
Here’s why ADX matters:
- It helps avoid trading in weak or sideways markets
- It confirms whether a trend is worth following
- It improves timing for entering and exiting trades
Without a tool like ADX, traders often enter trades too early or too late, especially during choppy market conditions.
How ADX Works
The ADX line ranges from 0 to 100 and reflects trend strength.
Here’s how to interpret it:
- Below 20: Weak trend or ranging market
- 20–40: Developing trend
- 40–60: Strong trend
- Above 60: Very strong trend (rare)
Important note:
ADX rising = trend is strengthening
ADX falling = trend is weakening
The ADX does not tell you whether the price is going up or down. That’s where +DI and -DI come in.
Understanding +DI and -DI
To fully use ADX, you need to understand the directional indicators:
- +DI measures bullish strength
- -DI measures bearish strength
How to read them:
- +DI above -DI → Uptrend
- -DI above +DI → Downtrend
- Crossovers can signal potential trend changes
When combined with ADX:
- Strong trend + bullish signal = buying opportunity
- Strong trend + bearish signal = selling opportunity
ADX Trading Strategy for Beginners
Let’s look at a simple and effective ADX strategy.
Step 1: Identify trend strength
Wait for ADX to rise above 20 or 25. This indicates a potential trend is forming.
Step 2: Check direction
- If +DI crosses above -DI → consider buying
- If -DI crosses above +DI → consider selling
Step 3: Confirm momentum
Ensure ADX is rising to confirm the trend is gaining strength.
Step 4: Exit strategy
- Exit when ADX starts falling (trend weakening)
- Or when DI lines cross in the opposite direction
This simple approach helps you avoid false signals and focus only on meaningful trends.
Best Settings for ADX
The default ADX setting is 14 periods, and this works well for most traders.
However, depending on your trading style:
- Short-term traders: Use 7–10 periods (more sensitive)
- Swing traders: Use 14 periods (balanced)
- Long-term traders: Use 20–30 periods (smoother signals)
There is no “perfect” setting, so it’s important to test and adjust based on your strategy.
Advantages of Using ADX
ADX is popular for a reason. Here are its key benefits:
- Helps identify strong trends early
- Filters out weak market conditions
- Works across all markets (forex, crypto, stocks)
- Easy to combine with other indicators
One of the biggest advantages is that ADX reduces emotional trading by providing objective data.
Limitations of ADX
Despite its usefulness, ADX is not perfect.
Here are some limitations:
- It is a lagging indicator (based on past price data)
- Does not show trend direction by itself
- Can give late signals in fast-moving markets
- Less effective in highly volatile sideways markets
This is why ADX should always be used alongside other tools like support/resistance, moving averages, or price action.
Common Mistakes When Using ADX
Many beginners misuse ADX, leading to poor results.
Avoid these common mistakes:
- Using ADX alone without DI lines
- Entering trades when ADX is below 20
- Ignoring whether ADX is rising or falling
- Assuming high ADX always means buy
Remember:
High ADX means strong trend — not necessarily an uptrend.
Combining ADX with Other Indicators
To improve accuracy, combine ADX with other indicators.
Popular combinations include:
- ADX + Moving Averages
Helps confirm both trend direction and strength - ADX + RSI
Identifies overbought/oversold conditions within strong trends - ADX + Support/Resistance
Confirms breakouts with strong trend momentum
For example, a breakout above resistance with ADX rising above 25 is a much stronger signal than a breakout alone.
When Should You Use ADX?
ADX works best in trending markets.
Ideal situations:
- Breakouts from consolidation
- Strong bullish or bearish runs
- Trending forex pairs or crypto assets
Avoid using ADX in:
- Flat or sideways markets
- Low volatility conditions
Knowing when NOT to use ADX is just as important as knowing when to use it.
Practical Example of ADX in Action
Imagine a stock that has been moving sideways for days.
Suddenly:
- ADX rises above 25
- +DI crosses above -DI
This signals:
- A new trend may be starting
- The trend is gaining strength
A trader could enter a buy position and ride the trend until ADX begins to decline.
This simple process can significantly improve trade success rates.
Tips for Mastering ADX
Here are some practical tips to get better results:
- Always wait for confirmation (don’t rush entries)
- Focus on ADX direction, not just value
- Combine with price action for better accuracy
- Backtest your strategy before using real money
Consistency is key. The more you practice, the better you’ll understand how ADX behaves in different market conditions.
Conclusion
The Average Directional Index (ADX) is a powerful tool for measuring trend strength. While it doesn’t tell you direction, it helps you determine whether a trend is worth trading.
For beginners, ADX provides a structured way to:
- Avoid weak markets
- Identify strong trends
- Improve entry and exit timing
When used correctly and combined with other indicators, ADX can become an essential part of your trading strategy.
Start simple, practice consistently, and focus on understanding how trends behave. Over time, ADX will help you trade with more confidence and clarity.