Introduction
In the world of financial markets, volatility is one of the most critical factors influencing trading decisions. Whether you are a day trader, swing trader, or long-term investor, understanding how much an asset’s price fluctuates can significantly improve your strategy. One of the most widely used indicators for measuring market volatility is the Average True Range (ATR).
Developed by J. Welles Wilder Jr., ATR has stood the test of time and remains a fundamental tool in technical analysis. Unlike other indicators that attempt to predict price direction, ATR focuses solely on volatility—how much price moves, not where it moves.
What is Average True Range (ATR)?
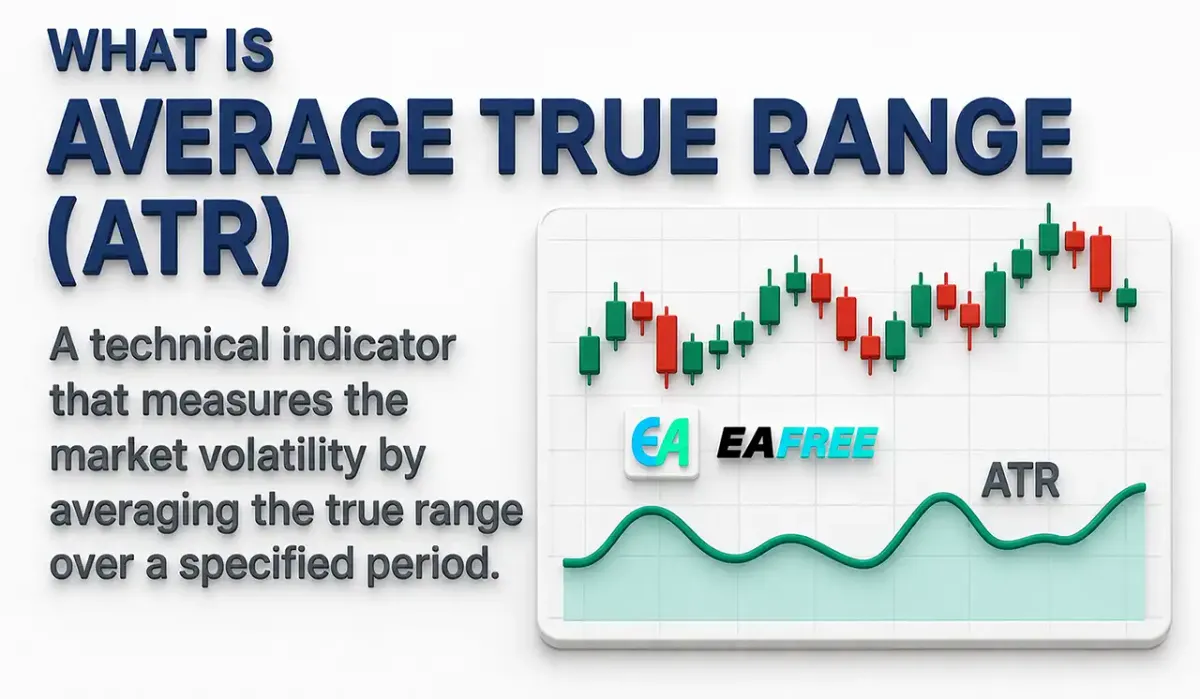
The Average True Range (ATR) is a technical analysis indicator that measures market volatility by calculating the average range between high and low prices over a specific period.
Unlike simple range calculations, ATR considers gaps and limit moves, making it more accurate in reflecting real market behavior.
//Key Characteristics of ATR:
- Measures volatility, not trend direction
- Works across all markets: stocks, forex, crypto, commodities
- Adapts to changing market conditions
- Helps traders set stop-loss and take-profit levels
A higher ATR indicates higher volatility, while a lower ATR suggests a quieter market.
Understanding True Range (TR)
Before diving into ATR, it's essential to understand the concept of True Range (TR).
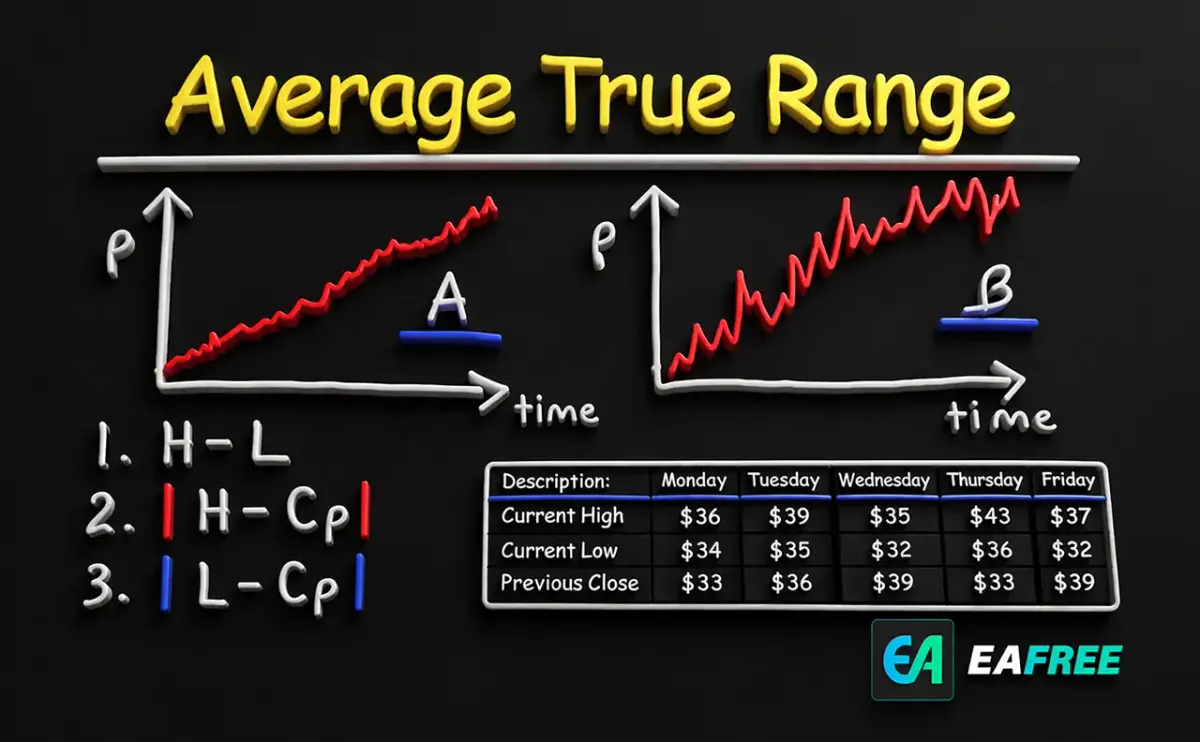
True Range is the greatest of the following three values:
- Current High − Current Low
- |Current High − Previous Close|
- |Current Low − Previous Close|
This calculation ensures that price gaps are included, which is especially important in markets like stocks or cryptocurrencies where gaps frequently occur.
How is ATR Calculated?
ATR is typically calculated over 14 periods (though traders can adjust this based on their strategy).
//Step-by-step Calculation:
- Calculate True Range (TR) for each period
- Compute the initial ATR as the average of the first 14 TR values
- Apply smoothing for subsequent values:
ATR = [(Previous ATR × (n − 1)) + Current TR] / n
Where:
- n = number of periods (commonly 14)
This smoothing method makes ATR responsive but not overly sensitive to sudden spikes.
Why ATR is Important in Trading
ATR plays a crucial role in trading because it helps traders understand how much price is moving, which is essential for risk management.
//1. Volatility Measurement
ATR tells you whether the market is:
- Calm (low ATR)
- Active (high ATR)
This helps traders decide whether it's a good time to enter or stay out of the market.
//2. Position Sizing
Traders can use ATR to determine how large their position should be. Higher volatility usually means smaller position sizes to manage risk.
//3. Stop-Loss Placement
ATR is widely used to set stop-loss (SL) levels dynamically instead of using fixed distances.
Example:
- Stop-loss = Entry Price − (2 × ATR)
This ensures that your stop-loss adapts to market conditions rather than being too tight or too loose.
//4. Avoiding Market Noise
Markets often have small fluctuations that can trigger premature exits. ATR helps filter out this noise by accounting for normal price movement.
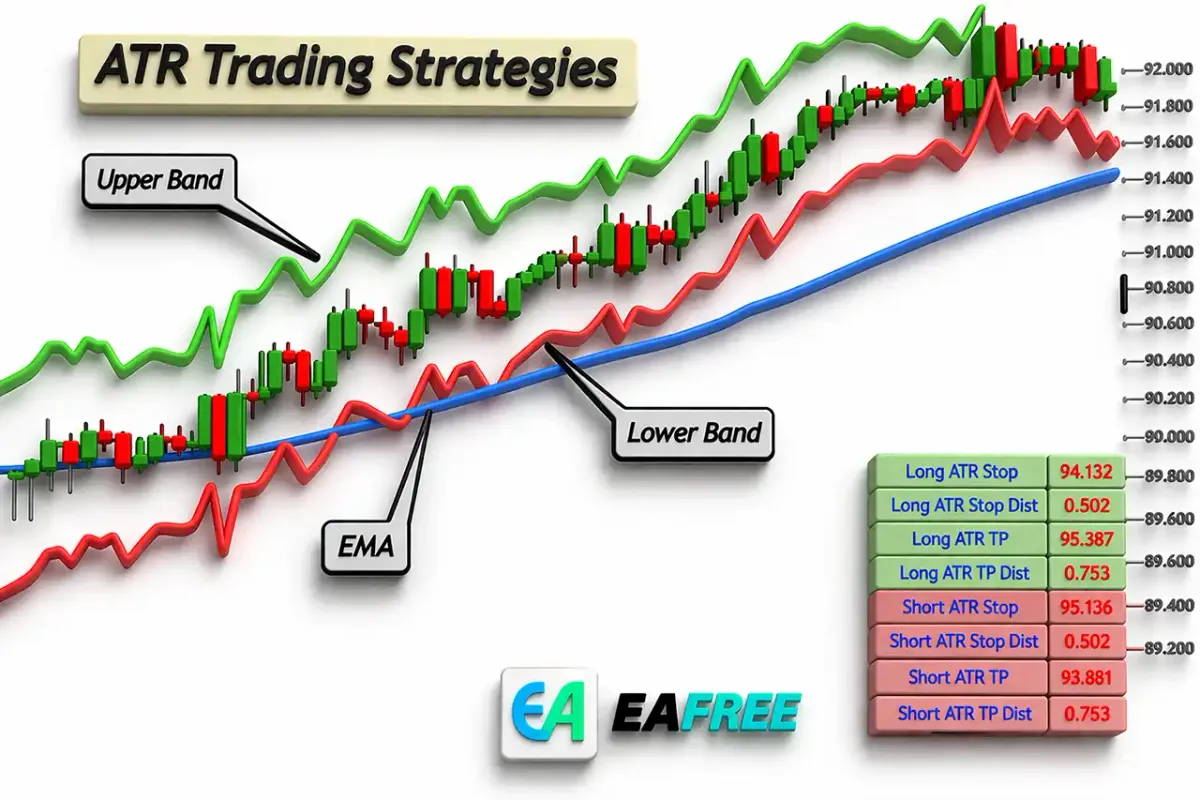
How to Use ATR in Trading Strategies
//1. ATR-Based Stop Loss
One of the most popular uses of ATR is for setting stop-loss levels.
Example:
- ATR = 1.5
- Entry Price = $100
- Stop Loss = $100 − (2 × 1.5) = $97
This method ensures your stop-loss accounts for normal volatility.
//2. ATR Trailing Stop
ATR can also be used to trail stop-loss levels as the price moves in your favor.
- In an uptrend: Move stop-loss upward using ATR
- In a downtrend: Move stop-loss downward
This helps lock in profits while allowing the trade to continue.
//3. Breakout Confirmation
High ATR values often indicate strong market movement.
- Rising ATR + breakout = strong move
- Low ATR + breakout = possible false breakout
This makes ATR a useful tool for confirming breakouts.
//4. Identifying Market Conditions
ATR can help traders distinguish between:
- Trending markets → Often accompanied by rising ATR
- Sideways markets → Typically show low ATR
This allows traders to adjust strategies accordingly.
ATR vs Other Volatility Indicators
While ATR is widely used, it is not the only volatility indicator.
//ATR vs Bollinger Bands
- ATR measures volatility directly
- Bollinger Bands measure volatility relative to a moving average
//ATR vs Standard Deviation
- ATR focuses on price range
- Standard deviation focuses on price dispersion
ATR is often preferred for its simplicity and adaptability across different markets.
Advantages of Using ATR
//1. Simplicity
ATR is easy to understand and implement, even for beginners.
//2. Versatility
It works across different timeframes and asset classes.
//3. Reliable Volatility Measure
By incorporating gaps, ATR provides a more realistic view of volatility.
//4. Improves Risk Management
ATR helps traders avoid setting arbitrary stop-loss levels.
Limitations of ATR
While ATR is powerful, it is not without limitations.
//1. No Directional Insight
ATR does not indicate whether price will go up or down.
//2. Lagging Indicator
Since it is based on past data, ATR reacts rather than predicts.
//3. Requires Combination with Other Tools
ATR works best when combined with trend indicators like moving averages or RSI.
Best Practices for Using ATR
To get the most out of ATR, consider the following tips:
//1. Combine with Trend Indicators
Use ATR alongside indicators like:
This gives you both volatility and direction.
//2. Adjust Period Settings
- Shorter periods (e.g., 7) → More sensitive
- Longer periods (e.g., 21) → Smoother
Choose based on your trading style.
//3. Use ATR for Risk Management, Not Signals
ATR is best used to manage trades, not to generate entry signals.
//4. Avoid Over-Reliance
No single indicator should be used alone. Always confirm with other tools.
Real-World Example of ATR in Action
Imagine a trader analyzing a stock:
- ATR (14) = 2.0
- Entry Price = $50
Instead of setting a fixed $1 stop-loss, the trader uses ATR:
- Stop-loss = $50 − (2 × 2.0) = $46
This allows the trade to breathe while still managing risk effectively.
Conclusion
The Average True Range (ATR) is a powerful and essential tool for measuring market volatility. While it does not predict price direction, its ability to quantify price movement makes it invaluable for risk management and trade planning.
By incorporating ATR into your trading strategy, you can:
- Set smarter stop-loss levels
- Adjust position sizes based on volatility
- Identify strong market conditions
- Avoid unnecessary losses caused by market noise
Ultimately, ATR helps traders make more informed decisions by providing a clearer understanding of market behavior.
Whether you are a beginner or an experienced trader, mastering ATR can significantly enhance your trading performance and discipline.