Introduction
In the world of technical analysis, traders are constantly searching for reliable indicators that can help identify trends, reversals, and potential entry or exit points. One such powerful yet often underrated tool is the Commodity Channel Index (CCI).
Originally developed for commodities, the CCI has evolved into a versatile indicator used across stocks, forex, and cryptocurrencies. Whether you are a beginner or an experienced trader, understanding how to use CCI effectively can significantly improve your trading decisions.
In this guide, we will break down the CCI formula, explore proven trading strategies, and walk through real-world examples—all in a clear, easy-to-understand way.
What is the Commodity Channel Index (CCI)?
The Commodity Channel Index (CCI) is a momentum-based oscillator that measures how far an asset’s price deviates from its average price over a given period.
In simple terms, it helps traders answer this question:
👉 Is the price unusually high or unusually low compared to its recent average?
- When CCI is high, the price may be overbought
- When CCI is low, the price may be oversold
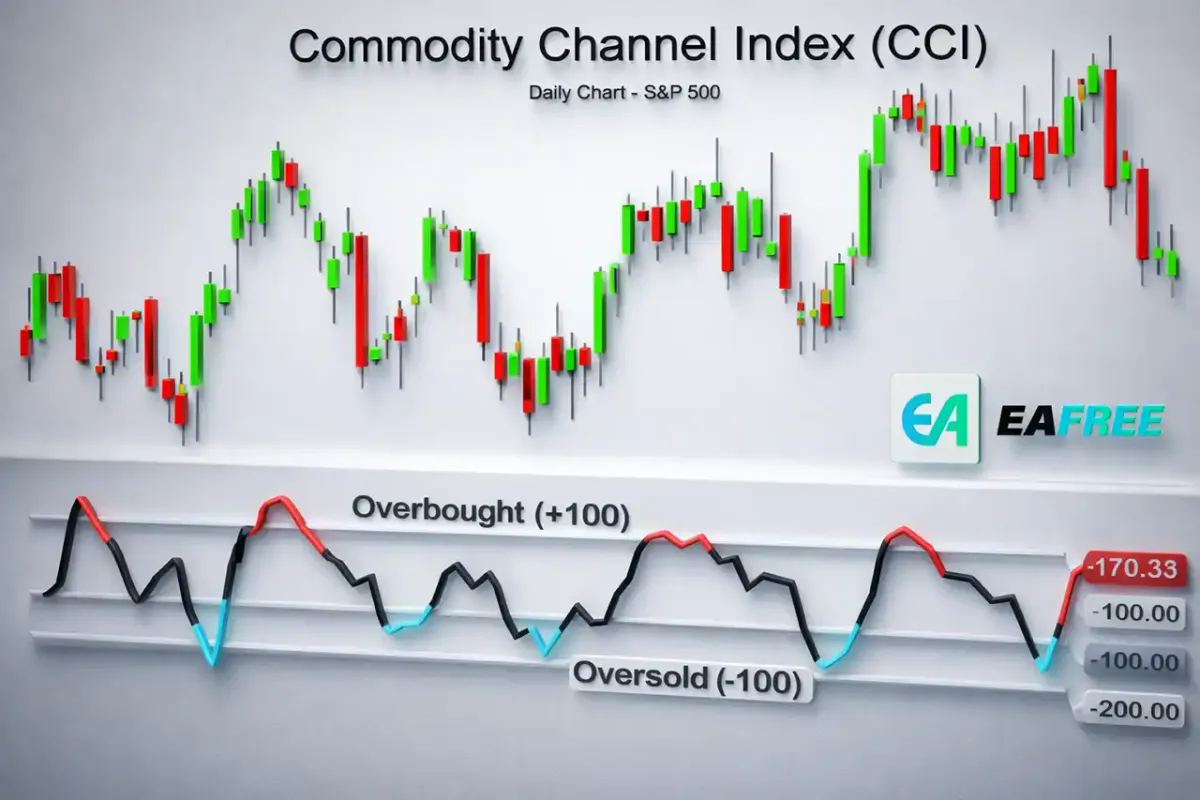
Unlike many indicators that are bounded (like RSI), CCI is unbounded, meaning it can go beyond fixed limits. However, traders typically focus on these key levels:
- +100 → Strong upward momentum (potential overbought)
- -100 → Strong downward momentum (potential oversold)
The CCI Formula Explained
Understanding the formula behind CCI helps you trust and use the indicator more effectively.
//CCI Formula:

//Components Breakdown:
- Typical Price (TP):

- Simple Moving Average (SMA):
- The average of the Typical Price over a chosen period (usually 14 or 20)
- Mean Deviation:
- Measures how far prices deviate from the SMA
- Constant (0.015):
- Ensures that most CCI values fall between -100 and +100
//Why This Formula Matters
The formula essentially compares current price behavior vs historical average behavior.
- If price deviates significantly upward → CCI rises
- If price drops significantly → CCI falls
This makes CCI extremely useful for spotting market extremes.
How to Interpret the CCI Indicator
//1. Overbought and Oversold Levels
- CCI > +100
- Price is unusually high.
- Possible reversal or continuation breakout.
- CCI < -100
- Price is unusually low.
- Possible bounce or trend continuation.
👉 Important: Overbought does NOT always mean “sell,” and oversold does NOT always mean “buy.”
//2. Trend Identification
CCI is excellent for identifying trends:
- Sustained movement above +100 → Strong uptrend
- Sustained movement below -100 → Strong downtrend
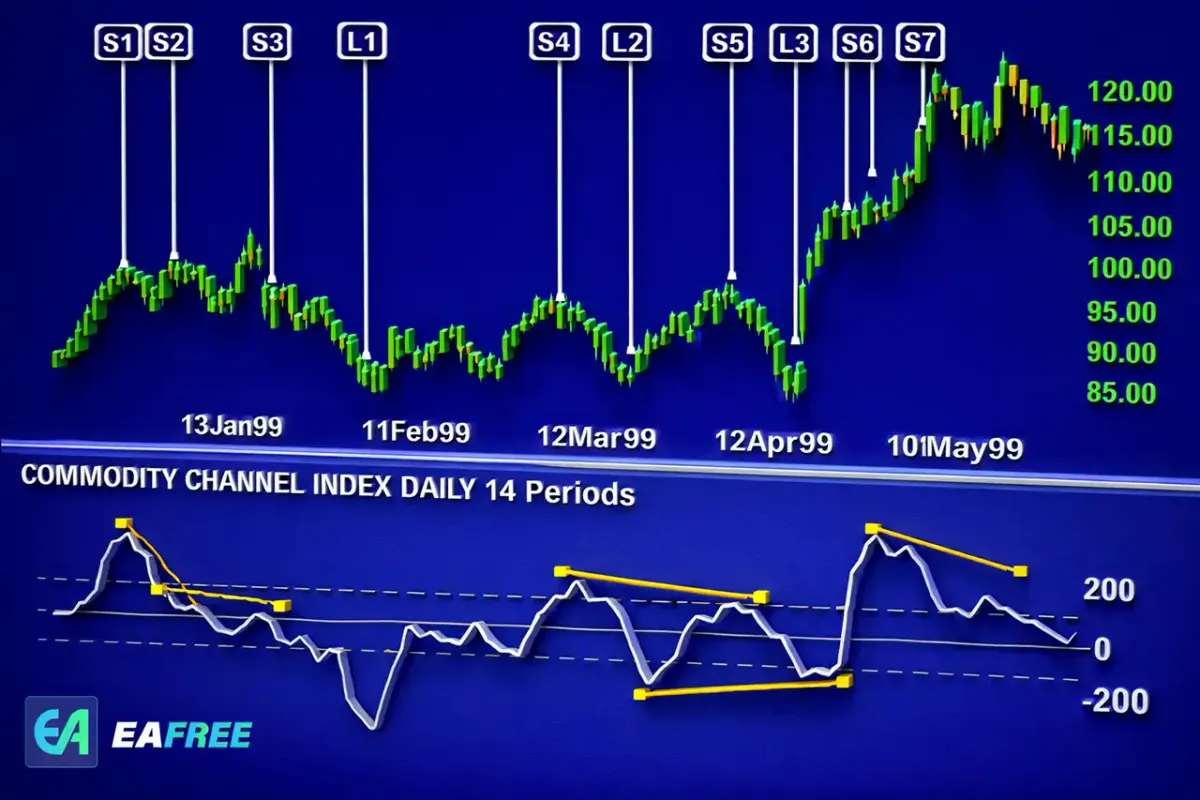
//3. Divergence Signals
Divergence occurs when price and CCI move in opposite directions:
- Bullish Divergence
- Price makes lower lows.
- CCI makes higher lows.
- → Potential upward reversal.
- Bearish Divergence
- Price makes higher highs.
- CCI makes lower highs.
- → Potential downward reversal.
Best CCI Settings
The most commonly used settings are:
- 14-period CCI → More sensitive (good for short-term trading)
- 20-period CCI → More stable (better for swing trading)
👉 Tip:
- Short-term traders prefer 14
- Long-term traders often use 20 or 30
Top CCI Trading Strategies
Let’s explore some practical strategies that traders use daily.
//1. CCI Breakout Strategy
This strategy focuses on momentum.
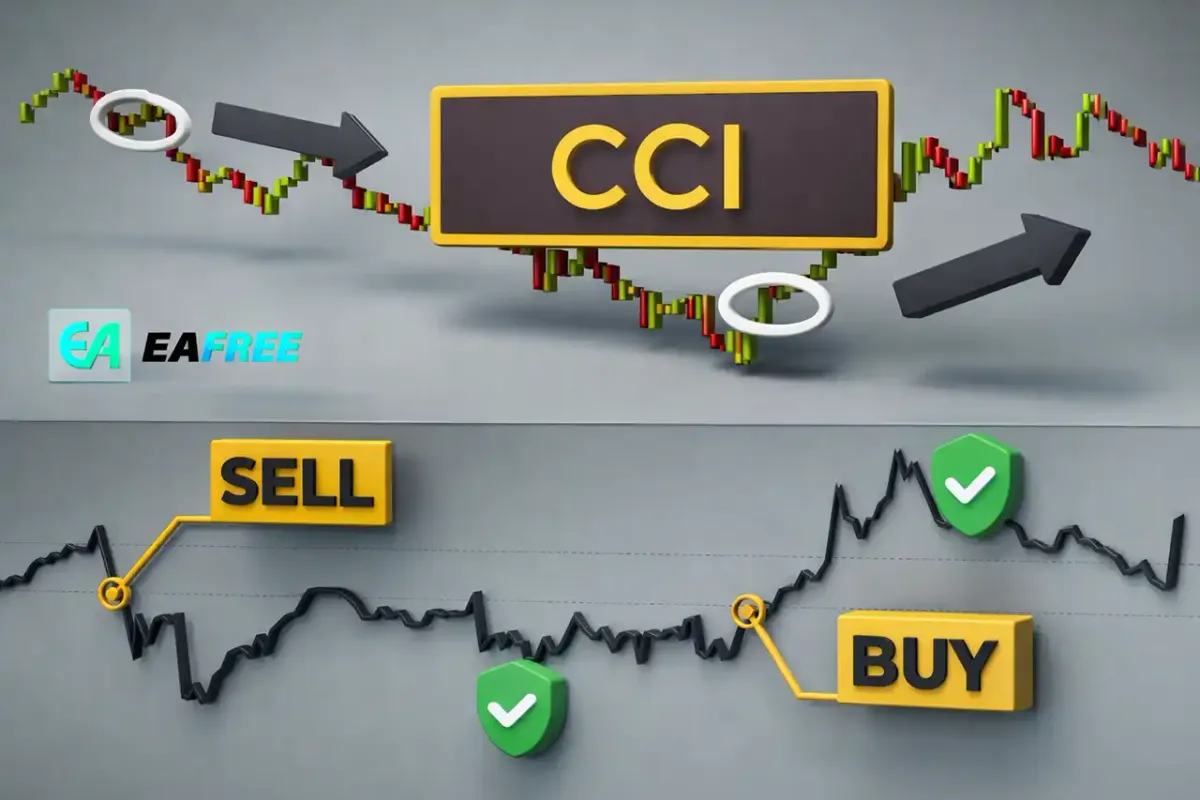
Buy Signal:
- CCI crosses above +100
Sell Signal:
- CCI crosses below -100
👉 Why it works:
- A breakout above +100 indicates strong bullish momentum.
- A drop below -100 signals strong bearish momentum.
Best Market Conditions:
- Trending markets
//2. CCI Pullback Strategy
This is a safer, trend-following strategy.
In an Uptrend:
- Wait for CCI to drop below 0
- Enter when CCI rises back above 0
In a Downtrend:
- Wait for CCI to rise above 0
- Enter when it drops below 0
👉 Why it works:
- It captures pullbacks within a larger trend
//3. CCI Divergence Strategy
This is used to identify reversals.
Bullish Setup:
- Price ↓ but CCI ↑
- Enter buy when price confirms reversal
Bearish Setup:
- Price ↑ but CCI ↓
- Enter sell after confirmation
👉 Best used with:
- Support and resistance levels
- Candlestick confirmation
//4. CCI + Moving Average Strategy
Combine CCI with a trend filter:
- Use a 50-day moving average
- Only take:
- Buy trades above MA
- Sell trades below MA
👉 Benefit:
- Reduces false signals
Real Trading Examples
//Example 1: CCI Breakout in an Uptrend
Imagine a stock trending upward:
- Price consolidates
- CCI stays below +100
- Suddenly, CCI breaks above +100
👉 This signals strong momentum → potential buy opportunity
Result:
- Price often continues rising
//Example 2: Oversold Bounce
A cryptocurrency drops sharply:
- CCI falls below -100
- Market shows signs of stabilization
👉 Traders enter buy positions
Result:
- Price rebounds as selling pressure fades
//Example 3: Bearish Divergence
In a forex pair:
- Price makes a higher high
- CCI makes a lower high
👉 Warning signal of weakening momentum
Result:
- Price reverses downward
Advantages of Using CCI
✔ Simple and easy to understand
✔ Works across all markets
✔ Effective for spotting extremes
✔ Great for both trend and reversal strategies
Limitations of CCI
❌ Can produce false signals in sideways markets
❌ Overbought/oversold signals can persist
❌ Needs confirmation from other indicators
👉 Best practice: Always combine CCI with other tools like:
- Support & resistance
- Trendlines
- Volume indicators
Pro Tips for Using CCI Effectively
- ✅ Don’t rely on CCI alone
- ✅ Use higher timeframes for stronger signals
- ✅ Combine with price action
- ✅ Avoid trading during low volatility
CCI vs RSI: Which is Better?
| Feature | CCI | RSI |
|---|---|---|
| Range | Unbounded | 0–100 |
| Sensitivity | Higher | Moderate |
| Best Use | Trends + extremes | Overbought/oversold |
👉 Conclusion:
- Use CCI for momentum and breakouts
- Use RSI for stability and confirmation
Conclusion
The Commodity Channel Index (CCI) is a powerful and flexible technical indicator that can help traders identify market trends, momentum shifts and potential reversals.
To recap:
- It measures price deviation from its average
- Key levels: +100 and -100
- Works best when combined with other tools
- Suitable for multiple trading strategies
Whether you're trading stocks, forex, or crypto, mastering the CCI can give you a significant edge.
Final Thoughts
Like any trading tool, the CCI is not perfect. But when used correctly—with discipline, confirmation, and proper risk management—it can become a valuable part of your trading strategy.
👉 Start simple:
- Apply CCI on your chart
- Observe how it reacts to price
- Practice with demo trades
Over time, you’ll develop the intuition needed to use it effectively.